Figure 2
Download original image
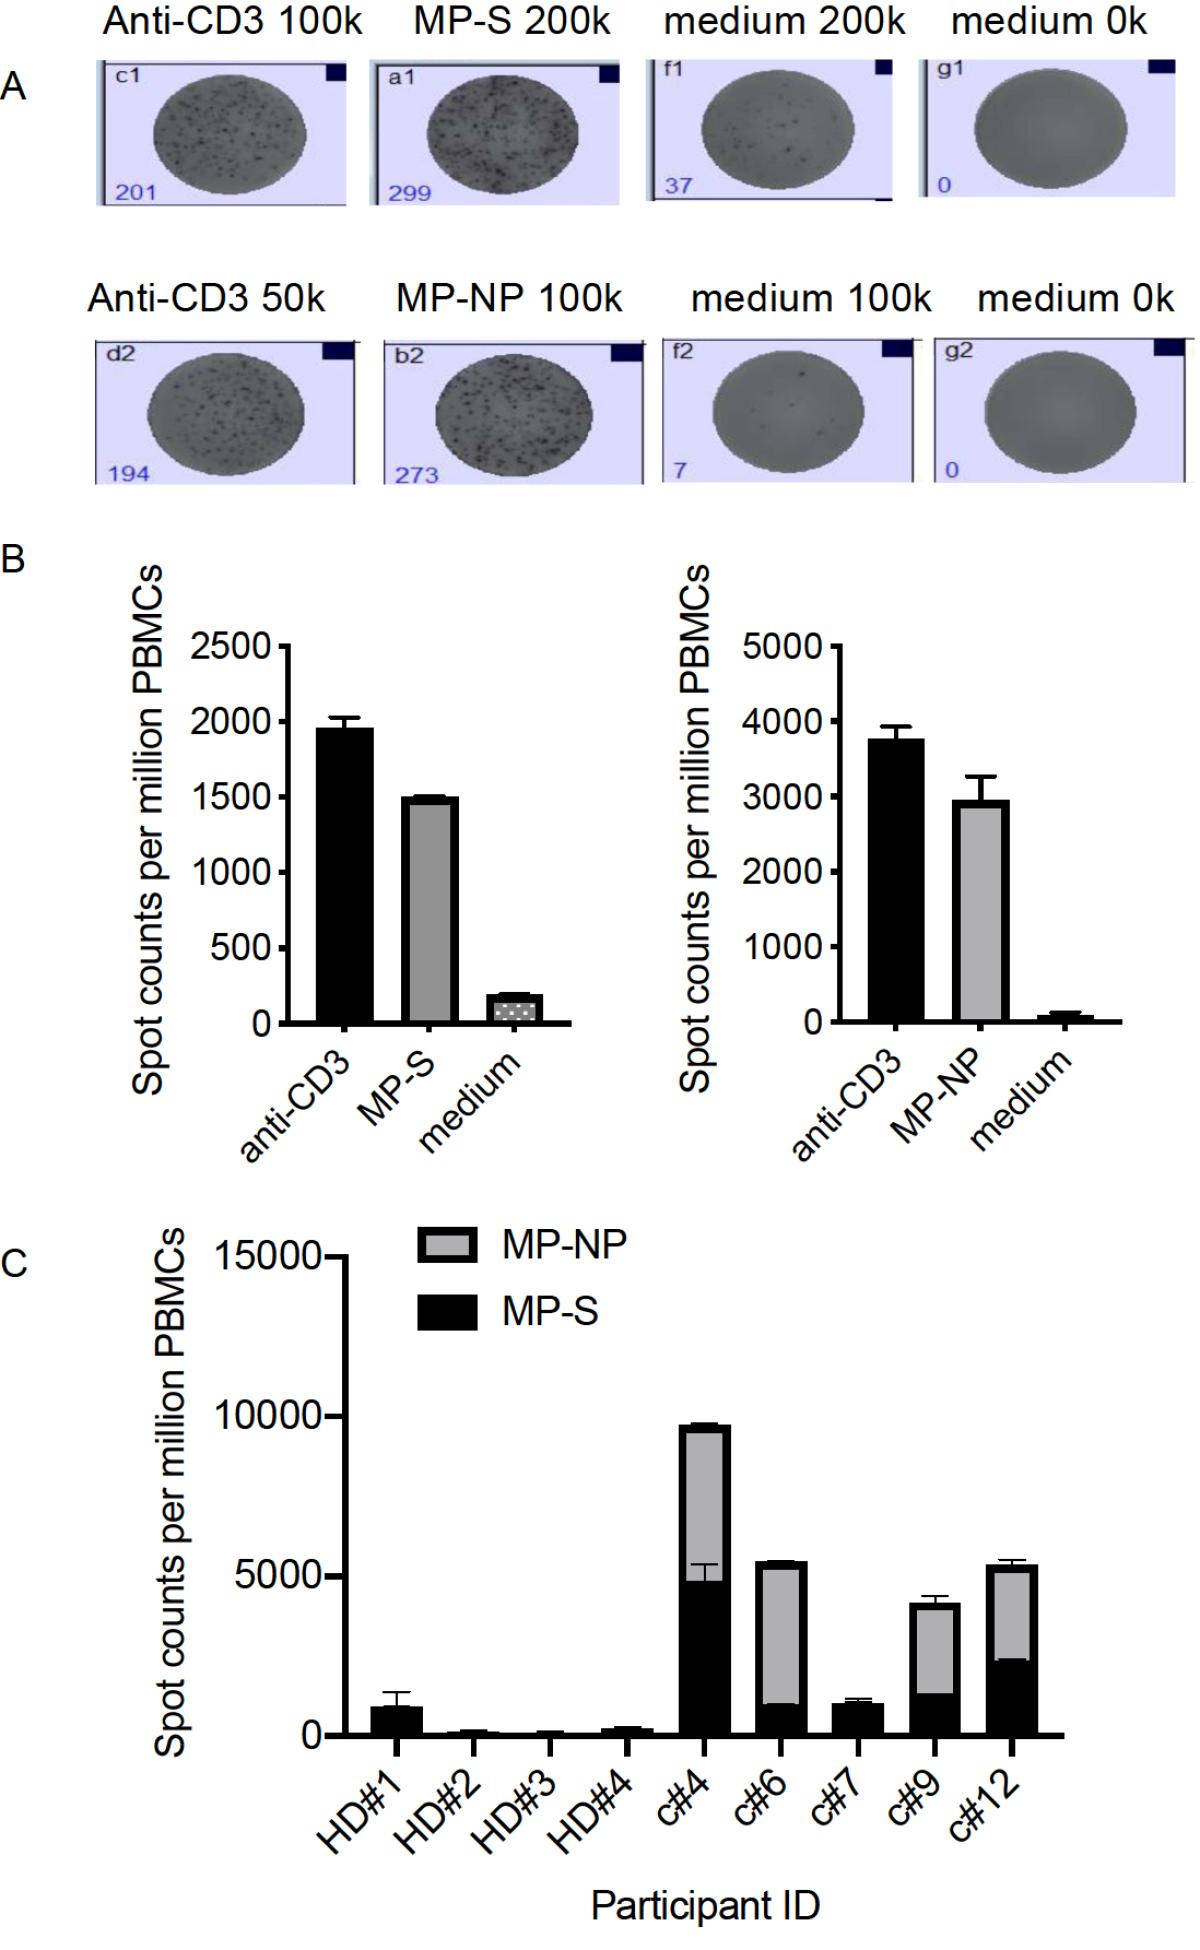
Detection of SARS-CoV-2-specific T cells in the convalescent subjects at 5–6 months post discharge. (A) Representative IFNγ ELISpot image. 0 –200k means 0–200k of PBMCs per well. (B) IFNγ ELISpot assay of spike- (left panel) and NP- (right panel) specific T cells from c#9 post-expansion. (C) Summarized IFNγ ELISpot data showing the frequency of S- and NP-specific T cells in the convalescent subjects. The experiment was done in duplicate. Data are presented as mean±SEM. HD, healthy donor; c, convalescent subject. MP-NP, NP peptide pool; MP-S, spike peptide pool.
Current usage metrics show cumulative count of Article Views (full-text article views including HTML views, PDF and ePub downloads, according to the available data) and Abstracts Views on Vision4Press platform.
Data correspond to usage on the plateform after 2015. The current usage metrics is available 48-96 hours after online publication and is updated daily on week days.
Initial download of the metrics may take a while.