Figure 3
Download original image
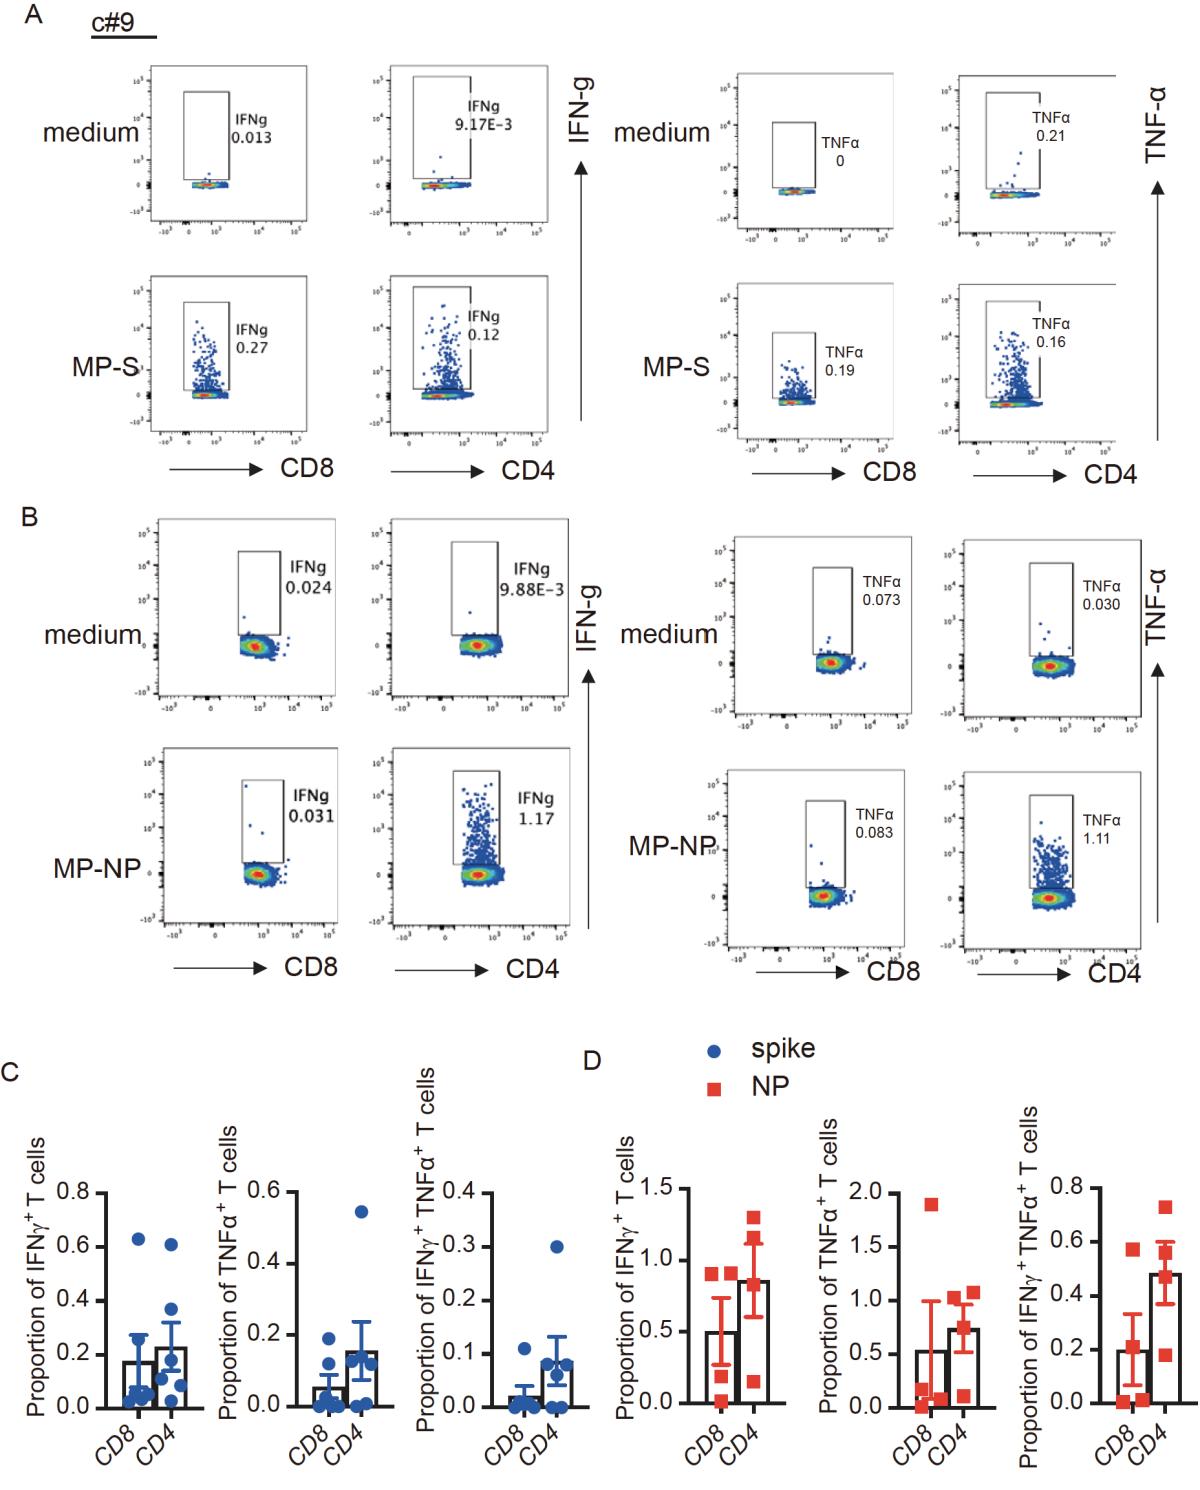
Detection of memory SARS-CoV-2-specific CD8 + and CD4 + effector T cells in convalescent subjects. (A) Flow cytometry plot showing S-specific IFNγ (left panel) and TNFα (right panel)-producing CD8 + and CD4 + T cells from c#9 at 6 months post discharge. (B) Flow cytometry plot showing NP-specific IFNγ (left panel) and TNFα (right panel)-expressing CD8 + and CD4 + T cells from c#9 at 10 months post discharge. (C) Summarized data showing spike-specific IFNγ, TNFα and IFNγ+TNFα-producing T cells in the convalescent subjects at 5–6 months post hospital discharge ( n=5). (D) Summarized data showing NP-specific IFNγ, TNFα and IFNγ+TNFα T cells in the convalescent subjects at 9–10 months post hospital discharge ( n=4). Data are presented as mean±SEM. MP-NP, NP peptide pool; MP-S, spike peptide pool.
Current usage metrics show cumulative count of Article Views (full-text article views including HTML views, PDF and ePub downloads, according to the available data) and Abstracts Views on Vision4Press platform.
Data correspond to usage on the plateform after 2015. The current usage metrics is available 48-96 hours after online publication and is updated daily on week days.
Initial download of the metrics may take a while.