Figure 3
Download original image
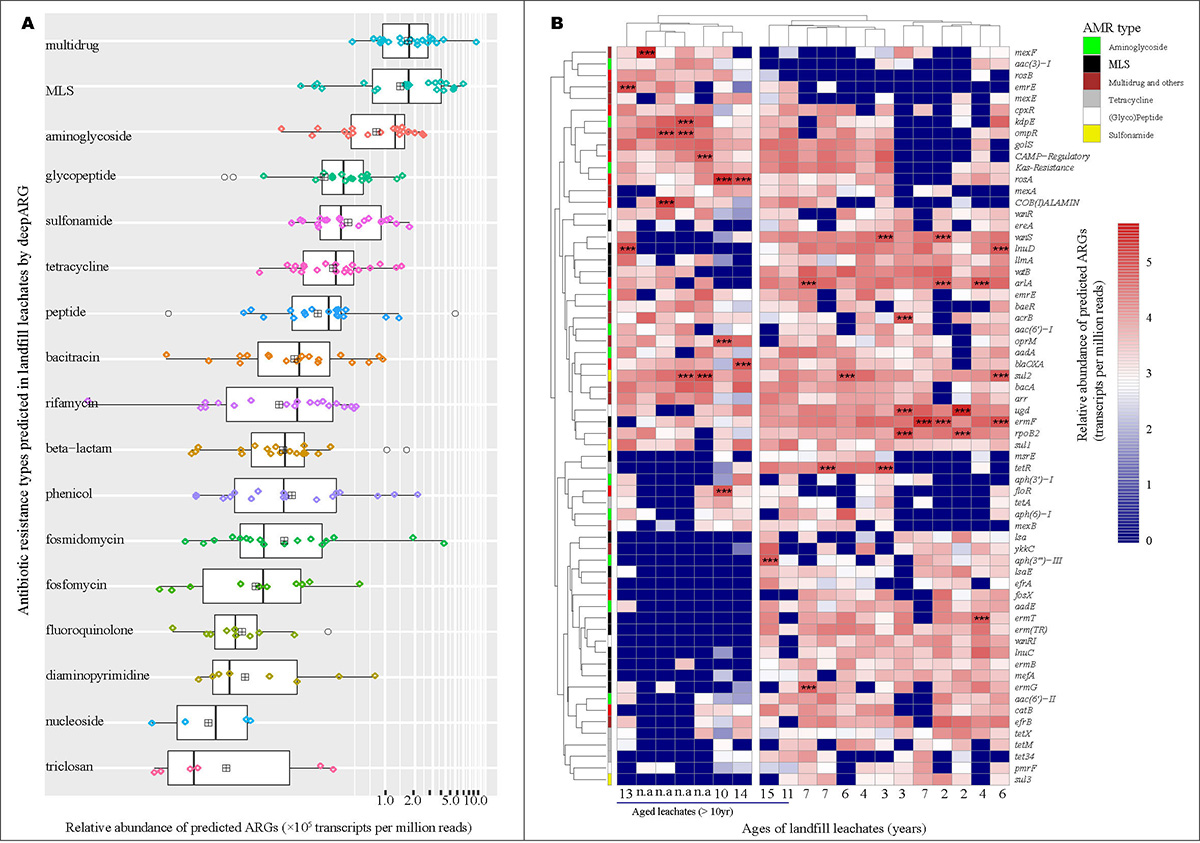
(A) Re-analyzed abundance of antibiotic resistome in landfill leachate. The circle dots represented the outliers in the datasets (transcript per million reads, TPM). The colored and black squares indicated the data points and their mean values, respectively. (B) Heatmap of core antibiotic resistome, which contained the ARG subtypes that were detected in more than 50% of the sequencing samples (n=20). The relative abundance of core ARGs higher than 104-TPM was annotated with asterisks.
Current usage metrics show cumulative count of Article Views (full-text article views including HTML views, PDF and ePub downloads, according to the available data) and Abstracts Views on Vision4Press platform.
Data correspond to usage on the plateform after 2015. The current usage metrics is available 48-96 hours after online publication and is updated daily on week days.
Initial download of the metrics may take a while.