Figure 3
Download original image
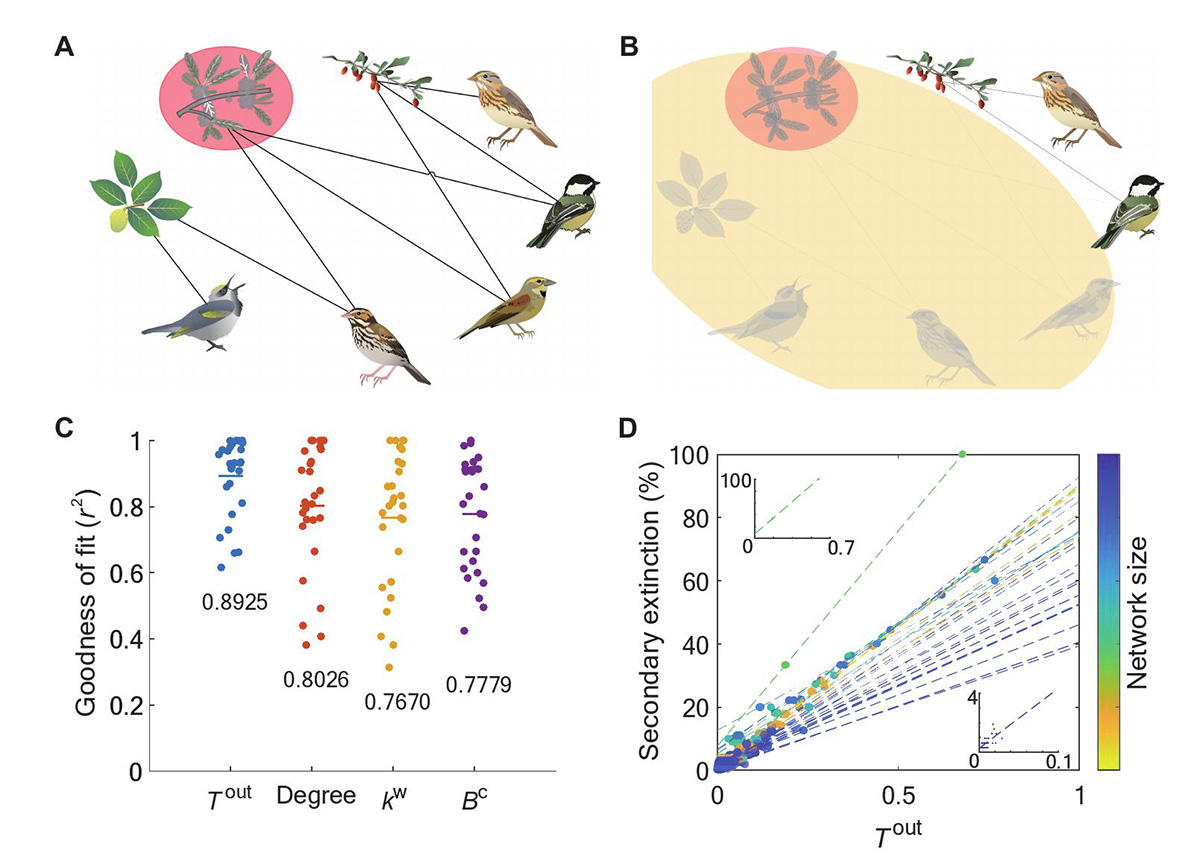
Relationship between the biodiversity loss and different indicators. (200 independent simulation runs) (A) and (B) The secondary extinction in an 8-component seed-disperser ecosystem. Removing species leads to massive biodiversity and interaction loss. Here, the local ecosystem may suffer remarkable degradation as shown in (B) compared with the original state. (C) Fitting secondary extinction size and
![]() , degree,
, degree,
![]() (weighted degree),
(weighted degree),
![]() (betweenness centrality) with a linear model after removing a single species. (D) Species with higher impact on the network (larger
(betweenness centrality) with a linear model after removing a single species. (D) Species with higher impact on the network (larger
![]() ) have larger disposition to induce massive secondary extinction. Dashed lines in different colors show the fitted linear model of different networks, which show the size evolution of secondary extinction along increasing
) have larger disposition to induce massive secondary extinction. Dashed lines in different colors show the fitted linear model of different networks, which show the size evolution of secondary extinction along increasing
![]() . Here colder color suggests larger networks while warmer color represents the smaller ones. The smaller pictures show two fitting curves with small and large slopes, which indicate small and large secondary extinction trends, respectively.
. Here colder color suggests larger networks while warmer color represents the smaller ones. The smaller pictures show two fitting curves with small and large slopes, which indicate small and large secondary extinction trends, respectively.
Current usage metrics show cumulative count of Article Views (full-text article views including HTML views, PDF and ePub downloads, according to the available data) and Abstracts Views on Vision4Press platform.
Data correspond to usage on the plateform after 2015. The current usage metrics is available 48-96 hours after online publication and is updated daily on week days.
Initial download of the metrics may take a while.