Figure 2
Download original image
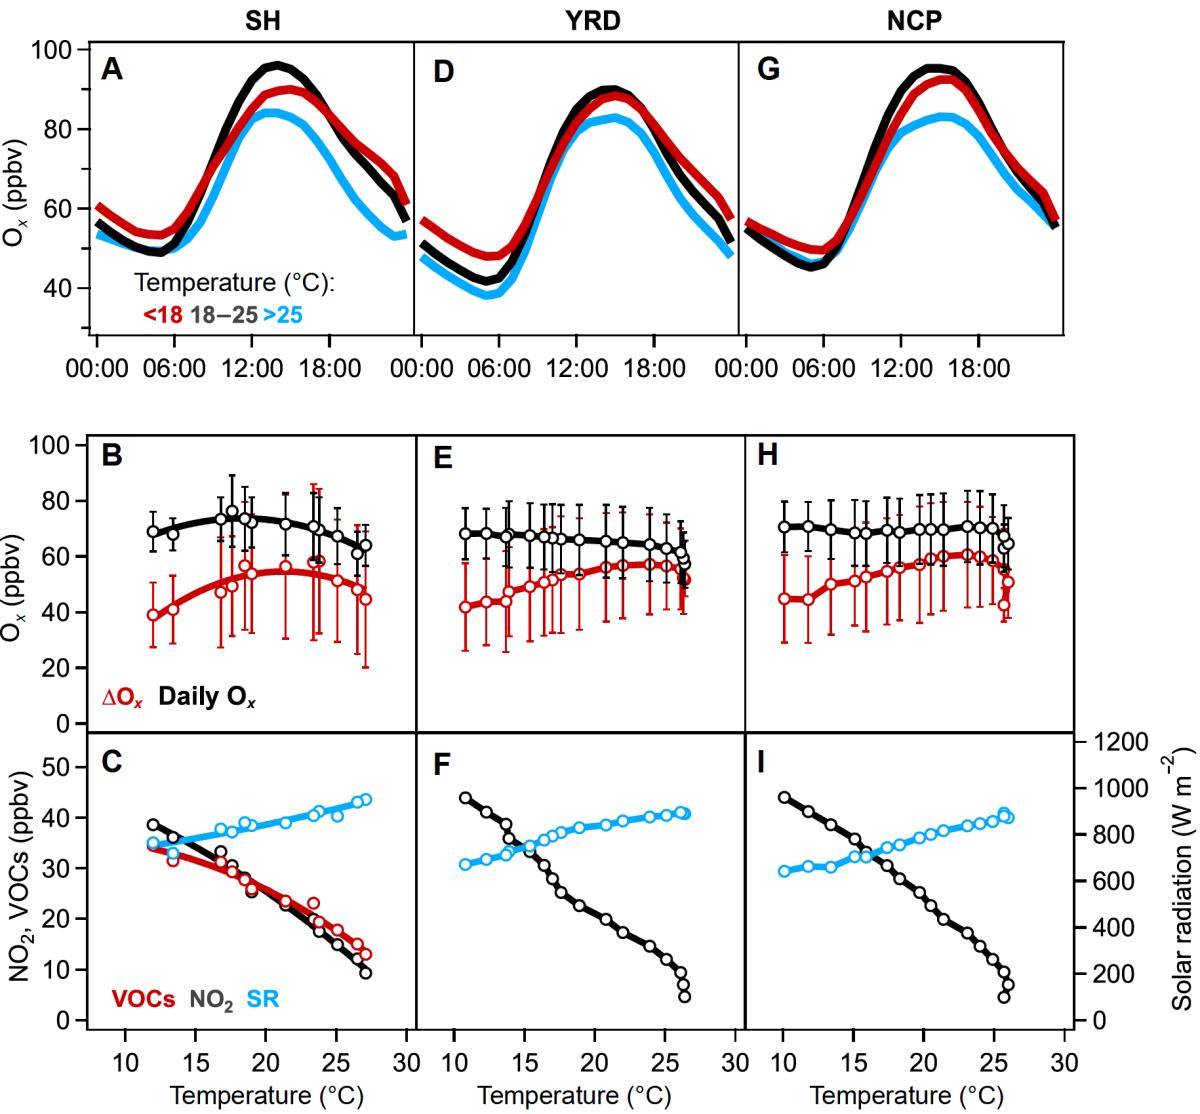
Observed diel variation of Ox (=O3+NO2), and relationship of the ΔOx as well as daily averaged data for Ox, NO2, VOCs and solar radiation with temperature during high Ox (maximum hourly averaged Ox >75 ppbv) days in Shanghai, YRD, and NCP regions. The sunny day (maximum of solar radiation >550 W m −2) observations were analyzed based on measurements from 2017 to 2019 of the national monitoring network. Results of Shanghai include 9 sites, that of YRD region include 180 sites in 41 major cities and that of NCP include 140 national monitoring sites in 30 major cities (Figure S1B). Values are averages over 2.5 ppbv NO2 bins for the daily average (at least 10/50 data points required in city/regional scale). The daily average data of VOCs during the same period were from an urban supersite in Shanghai. The meteorological variables were from the Surface Meteorological Stations in China. (A), (D), (G) Diel variation of Ox during photochemical smog days in Shanghai, YRD and NCP, respectively. The red, black and blue lines represent three temperature bins: <18°C, 18°C– 25°C and >25°C, which indicate cool seasons, warm seasons and mid-summer. (B), (E), (H) Dependences of the daily averaged Ox and daily ΔOx on averaged temperature. (C), (F), (I) Relationships of daily averaged NO2, VOCs and maximum solar radiation (SR) with the average temperature in Shanghai, YRD and NCP, respectively. The error bars indicate the standard variations.
Current usage metrics show cumulative count of Article Views (full-text article views including HTML views, PDF and ePub downloads, according to the available data) and Abstracts Views on Vision4Press platform.
Data correspond to usage on the plateform after 2015. The current usage metrics is available 48-96 hours after online publication and is updated daily on week days.
Initial download of the metrics may take a while.