Figure 2
Download original image
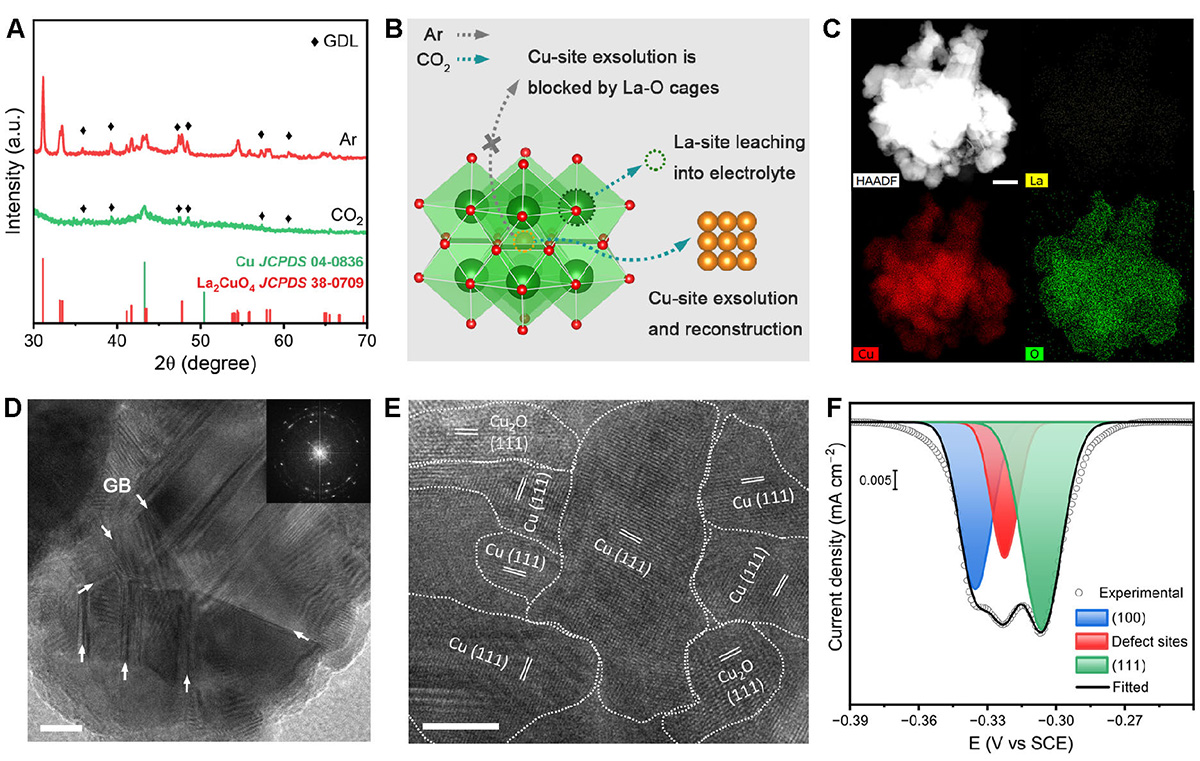
Physical characterization of POD-Cu. (A) XRD patterns of La2CuO4 electrodes after activation in Ar and CO2-feed catholyte. The diffraction peaks marked by black rhombus originated from GDL substrate. The weak Cu diffraction in XRD pattern was the result of the very low content of Cu on the GDL (about 0.16 mg cm−1). (B) Schematic diagram of the structural evolution of La2CuO4. (C) HAADF-STEM image and the corresponding EDX elemental mapping of POD-Cu. Scale bar: 100 nm. (D), (E) HR-TEM images of POD-Cu. Inset in (D) is the corresponding FFT pattern. Scale bars: 10 nm in (D) and 5 nm in (E). (F) Pb UPD profile of POD-Cu.
Current usage metrics show cumulative count of Article Views (full-text article views including HTML views, PDF and ePub downloads, according to the available data) and Abstracts Views on Vision4Press platform.
Data correspond to usage on the plateform after 2015. The current usage metrics is available 48-96 hours after online publication and is updated daily on week days.
Initial download of the metrics may take a while.