Figure 14
Download original image
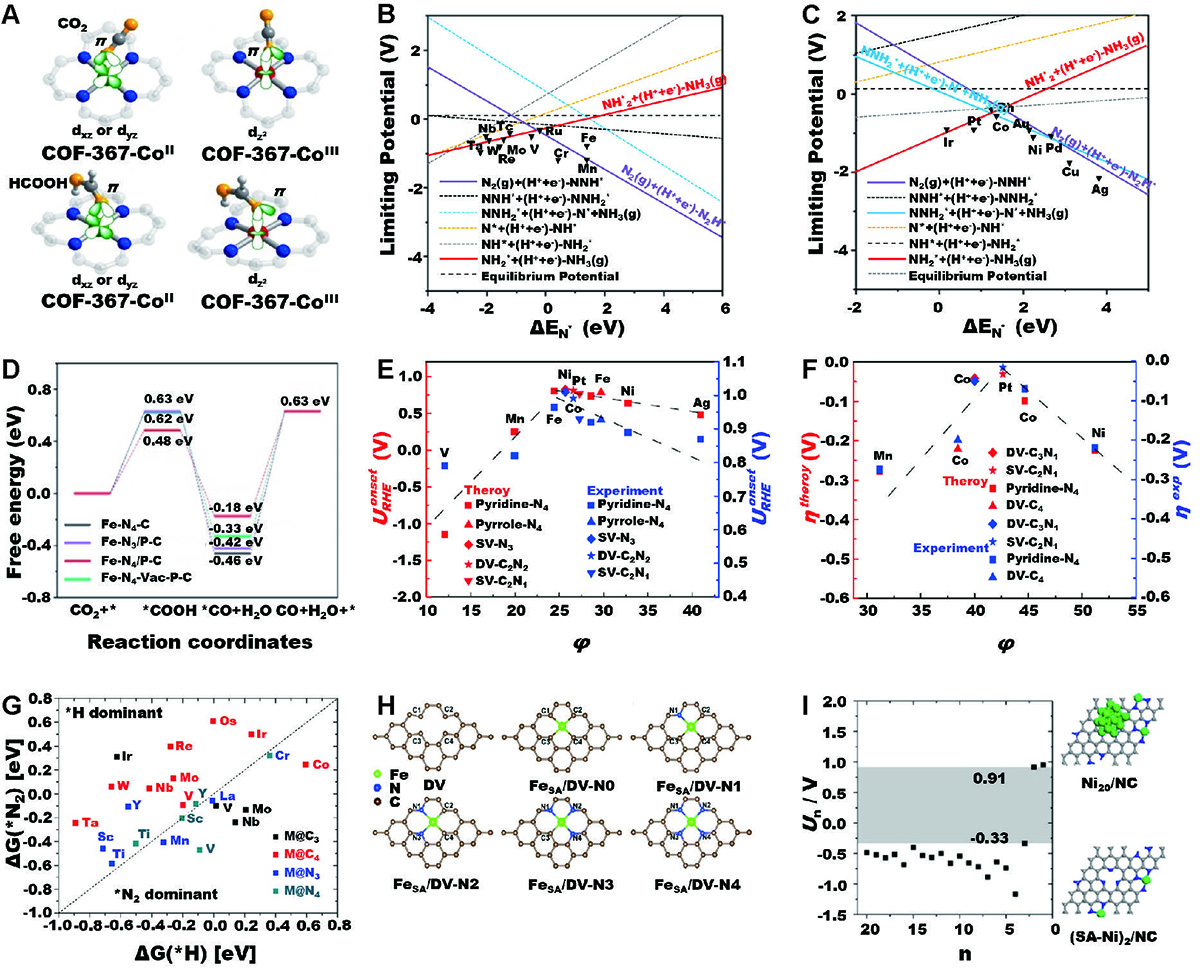
Coupling modes of (A) CO2 and HCOOH absorbed on COF-367-CoII and COF-367-CoIII. Reproduced with permission from ref. [134]. Copyright©2020, American Chemical Society. Limiting potentials of (B) early transition metal and (C) late transition metal. Reproduced with permission from ref. [139]. Copyright©2019, American Chemical Society. (D) Absorption volcano graph of Fe-N4-C, Fe-N3/P-C, Fe-N4/P-C, and Fe-N4-Vac-P-C for the electroreduction of CO2 to CO. Reproduced with permission from ref. [140]. Copyright©2022, American Chemical Society. Theoretical and corresponding experimental (E) onset potentials for ORR and (F) overpotentials for HER vs. the descriptor φ. Reproduced with permission from ref. [141]. Copyright©2018, Springer Nature. (G) Calculated ΔG(*H) and ΔG(*N2) on SACs. SACs in *N2 dominant region (under the dashed line, ΔG(*H) > ΔG(*N2)) correspond to N2 adsorption being more favorable than *H formation at 0 V (vs. RHE). Reproduced with permission from ref. [142]. Copyright©2018, American Chemical Society. (H) Bare carbon substrate and five different Fe-N-C coordination structures. Reproduced with permission from ref. [143]. Copyright©2020, Royal Society of Chemistry. (I) Electrochemical potential window of Ni/NC and the corresponding model of Ni20/NC and (SA-Ni)2/NC). Reproduced with permission from ref. [144]. Copyright©2020, American Chemical Society.
Current usage metrics show cumulative count of Article Views (full-text article views including HTML views, PDF and ePub downloads, according to the available data) and Abstracts Views on Vision4Press platform.
Data correspond to usage on the plateform after 2015. The current usage metrics is available 48-96 hours after online publication and is updated daily on week days.
Initial download of the metrics may take a while.