Figure 19
Download original image
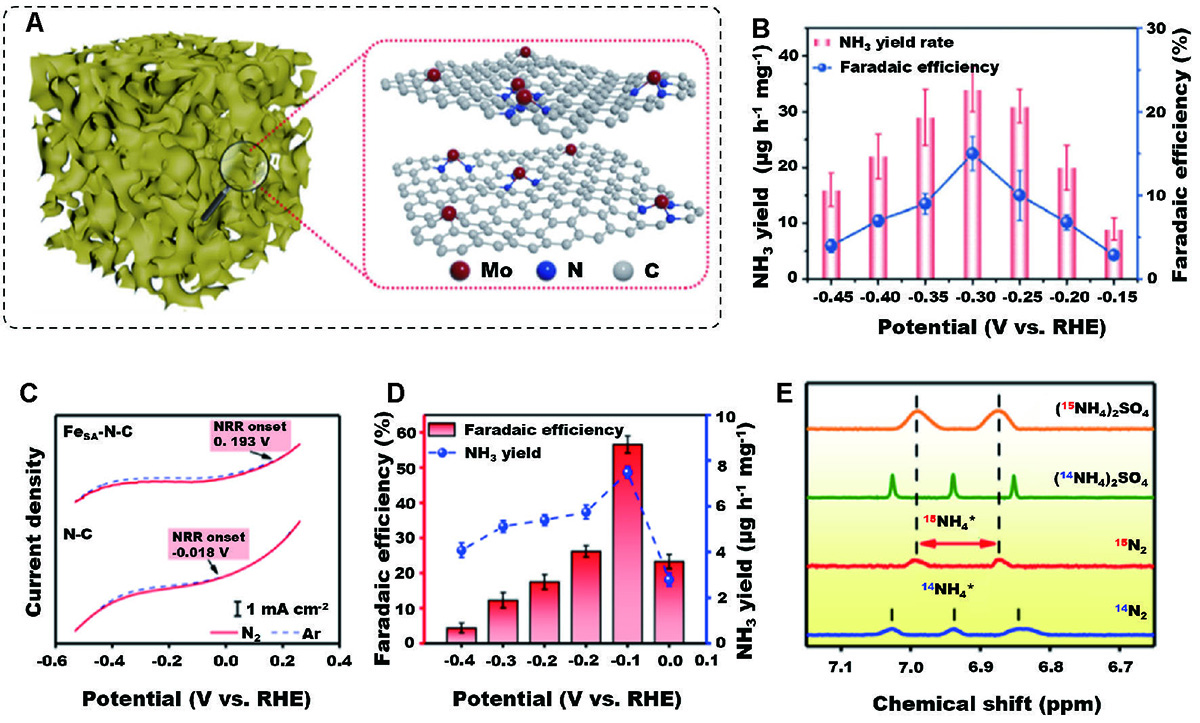
NPM-SACs/CS for NRR. (A) An illustration of SA-Mo/NPC and its corresponding atomic structure model. (B) NH3 yield rate (red) and FE (blue) at each given potential. Reproduced with permission from ref. [238]. Copyright©2019, John Wiley and Sons. (C) Linear sweep voltammograms of single-atom dispersed Fe-N-C (Fe SA-N-C) and nitrogen-doped carbon (N-C) in Ar-saturated (dashed line) or N2-saturated (solid line) 0.1 mol L−1 KOH solution with a scan rate of 50 mV s−1. (D) NH3 Faradaic efficiencies and mass-normalized yield rates at each given potential of Fe SA-N-C. (E) N15 isotope labeling experiment. Reproduced with permission from ref. [240]. Copyright©2019, Springer Nature.
Current usage metrics show cumulative count of Article Views (full-text article views including HTML views, PDF and ePub downloads, according to the available data) and Abstracts Views on Vision4Press platform.
Data correspond to usage on the plateform after 2015. The current usage metrics is available 48-96 hours after online publication and is updated daily on week days.
Initial download of the metrics may take a while.