Figure 6
Download original image
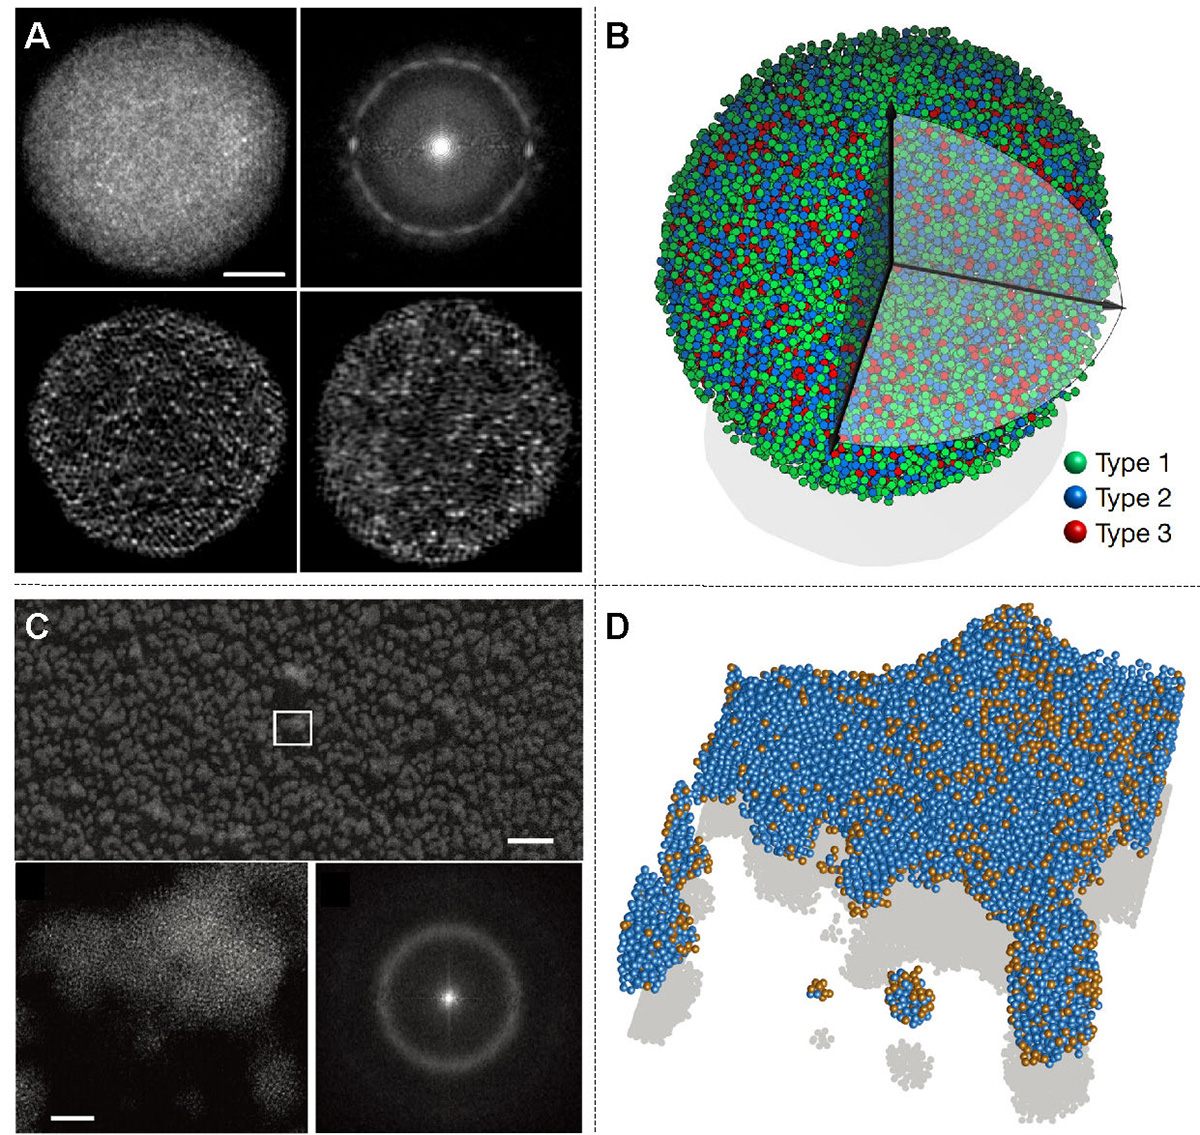
Determining 3D atomic positions in a glass-forming alloy (Adapted from ref. [60]. Copyright©2021, Springer Nature). (A) (top left) Representative experimental projection image, where some crystalline features are visible. Scale bar: 2 nm. (top right) Average 2D power spectrum of 55 experimental images, showing the amorphous halo. (bottom) Two 2.4-Å-thick slices of the 3D reconstruction in the x-y (left) and y-z (right) plane, where the majority of type-3 atoms (bright dots) are distributed in the second coordination shell. (B) Experimental 3D atomic model of the glass-forming nanoparticle. (C) (top) Large-field-of-view image of amorphous CuTa film. Scale bar: 30 nm. (bottom left) Magnified image of the region in the corresponding white square. Scale bar: 2 nm. (bottom right) Average 2D power spectrum of all the experimental images. (D) 3D atomic model of a portion of the CuTa thin film with a total of 1808 Cu (gold) and 12,774 Ta (blue) atoms.
Current usage metrics show cumulative count of Article Views (full-text article views including HTML views, PDF and ePub downloads, according to the available data) and Abstracts Views on Vision4Press platform.
Data correspond to usage on the plateform after 2015. The current usage metrics is available 48-96 hours after online publication and is updated daily on week days.
Initial download of the metrics may take a while.