Figure 8
Download original image
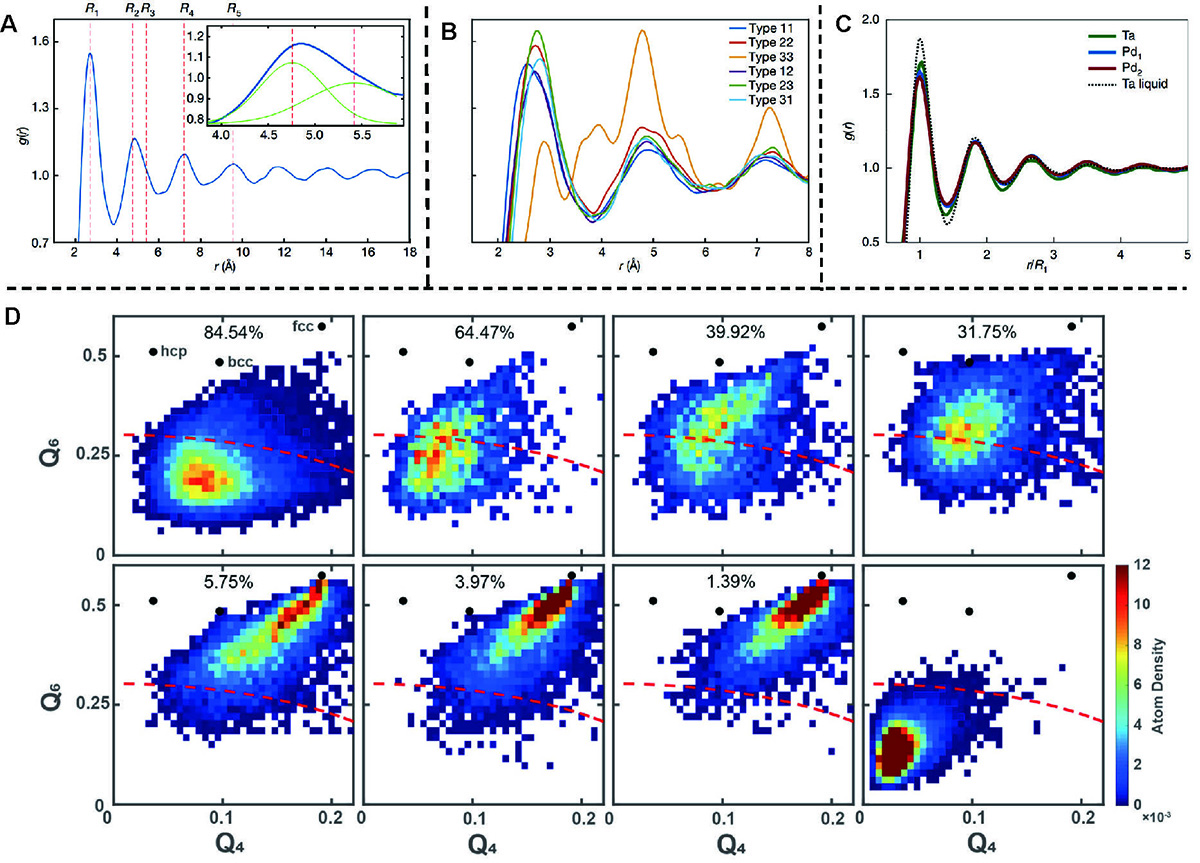
PDF and BOO analysis. (A) The PDF curve among all atoms in amorphous nanoparticles. The dashed lines point out the ideal peak positions of MG structure according to the theoretical analysis, which fits well in this specimen. The inset shows the second-peak splitting with a double Gaussian fit (Adapted from ref. [60]. Copyright©2021, Springer Nature). (B) The PDF curves between two types of atoms in an amorphous alloy NP, as listed in the legend. The curves emphasize the irregular behavior of the curve type 33 (Adapted from ref. [60]. Copyright©2021, Springer Nature). (C) The PDF curves of three monatomic amorphous solids and one theoretical simulation structure (Adapted from ref. [61]. Copyright©2022, Springer Nature). (D) The BOO analysis of all atoms in seven amorphous alloy nanoparticles separately. Cu65Zr35 simulated model analysis is presented as a reference. The red dashed lines show the criterion that divides the amorphous and crystal structure (Adapted from ref. [60]. Copyright©2021, Springer Nature).
Current usage metrics show cumulative count of Article Views (full-text article views including HTML views, PDF and ePub downloads, according to the available data) and Abstracts Views on Vision4Press platform.
Data correspond to usage on the plateform after 2015. The current usage metrics is available 48-96 hours after online publication and is updated daily on week days.
Initial download of the metrics may take a while.