Figure 2
Download original image
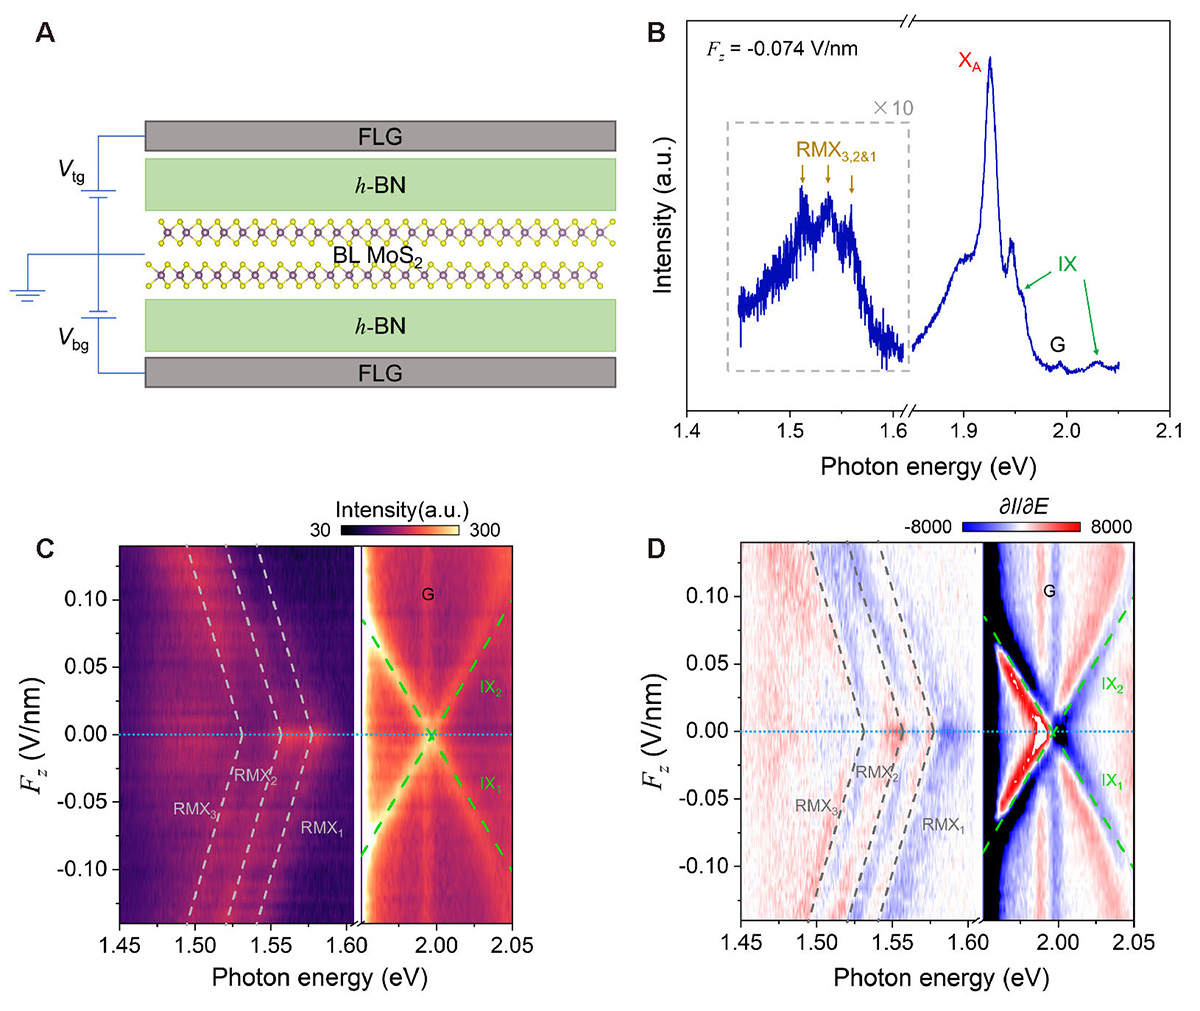
(A) Schematic of dual-gate h-BN encapsulated bilayer MoS2 device. (B) PL spectrum of device D1 at Fz = −0.074 V/nm. Note that the range of 1.45–1.60 eV is magnified by 10 times for clarity. (C) Contour plot of the PL spectra of device D1 as a function of photon energy (bottom axis) and Fz (left axis). The doping density remains unchanged. (D) First-order energy derivative of (C). Real- and momentum-indirect excitons are labelled as RMX1–3 in the sequence of decreasing emission energy. Gray (green) dashed lines in (C) and (D) represent linear-fits of RMX1–3 (IX1,2). The peak at around 1.99 eV that is insusceptible to Fz corresponds to the Raman G peak of graphene.
Current usage metrics show cumulative count of Article Views (full-text article views including HTML views, PDF and ePub downloads, according to the available data) and Abstracts Views on Vision4Press platform.
Data correspond to usage on the plateform after 2015. The current usage metrics is available 48-96 hours after online publication and is updated daily on week days.
Initial download of the metrics may take a while.