Figure 3
Download original image
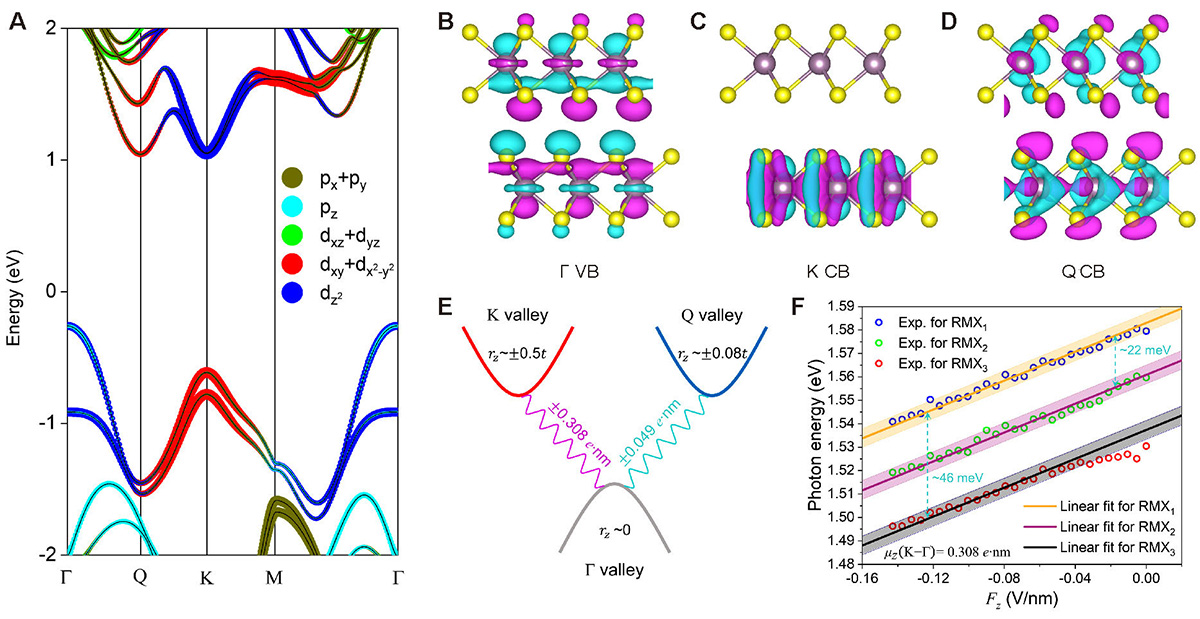
(A) Orbital-resolved projected band structure of bilayer MoS2 considering the spin-orbit coupling. (B), (C), (D) Distribution of real-part of spin-up wavefunctions in real-space at valence band Γ, conduction band K, and conduction band Q, respectively. (E) Possible transition configuration for K-Γ (purple wave) and Q-Γ (cyan wave). The red (blue) curve denotes conduction band K (Q). The grey curve denotes valence band Γ. The electric dipole moment of each transition is labelled. rz represents the equivalent position of the wavefunction at each valley as discussed in the main text. (F) Experimental results of the photon energy of RMX1 (blue hollows), RMX2 (green hollows) and RMX3 (red hollows) in device D1 as a function of Fz extracted from Figure 2C. Orange, purple, black solid lines and corresponding shadow regions denote the linear-fit of RMX1/2/3 with a fixed slope μz(K-Γ) obtained from DFT calculations. The energy difference between RMX1 and RMX2 (RMX3) is ~22 meV (46 meV).
Current usage metrics show cumulative count of Article Views (full-text article views including HTML views, PDF and ePub downloads, according to the available data) and Abstracts Views on Vision4Press platform.
Data correspond to usage on the plateform after 2015. The current usage metrics is available 48-96 hours after online publication and is updated daily on week days.
Initial download of the metrics may take a while.