Figure 4
Download original image
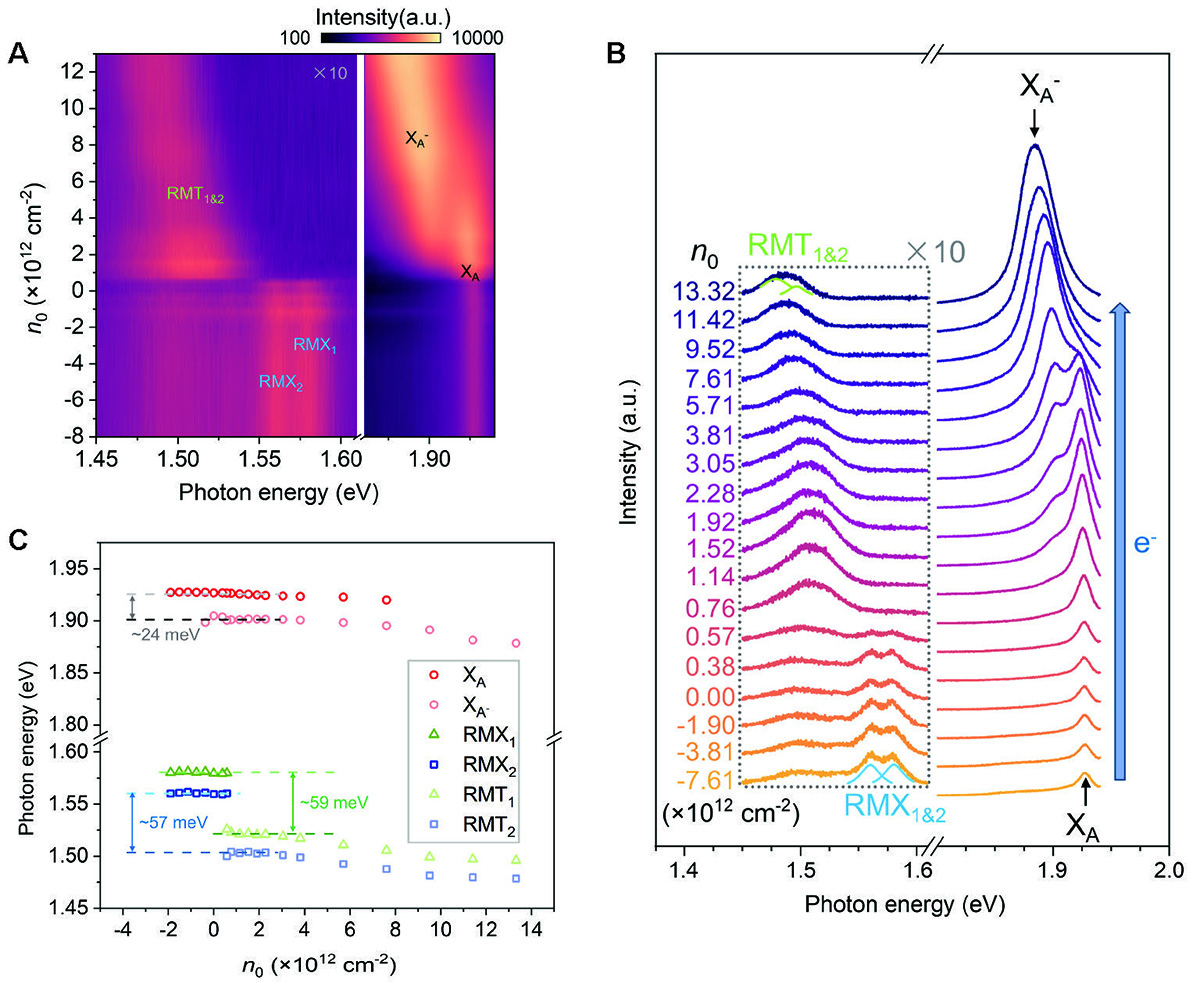
(A) Contour plot of the PL spectra of device D1 as a function of photon energy (bottom axis) and n0 (left axis). The out-of-plane electric field Fz is fixed at zero. (B) PL spectra at diverse n0. Cyan and green peaks represent Lorentz-fit peaks for RMX1&2 and RMT1&2, respectively. Note that the range of 1.45–1.60 eV in both (A) and (B) are magnified by 10 times for clarity. Offset is set in (B) for better resolution. (C) Lorentz-fitted results extracted from (B) of XA (red hollows), XA- (carmine hollows), RMX1 (green triangles), RMX2 (blue cubes), RMT1 (light green triangles) and RMT2 (light blue cubes). The binding energy of XA-, RMT1 and RMT2 is approximately 24, 59 and 57 meV, respectively.
Current usage metrics show cumulative count of Article Views (full-text article views including HTML views, PDF and ePub downloads, according to the available data) and Abstracts Views on Vision4Press platform.
Data correspond to usage on the plateform after 2015. The current usage metrics is available 48-96 hours after online publication and is updated daily on week days.
Initial download of the metrics may take a while.