Figure 1
Download original image
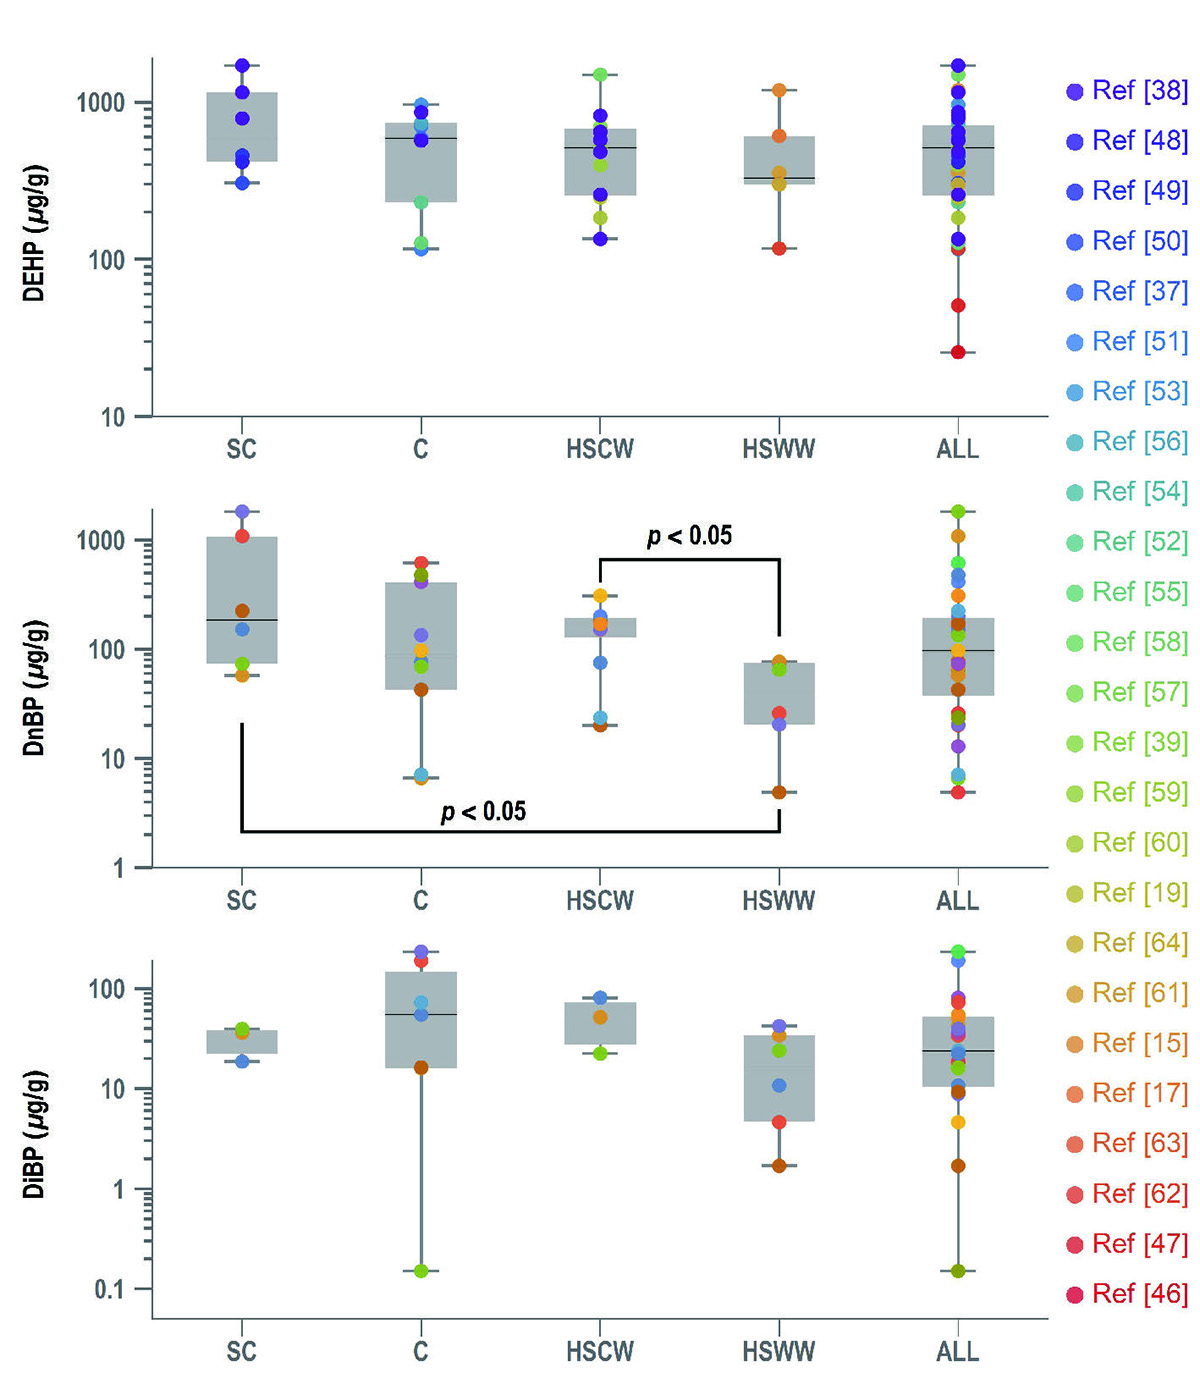
Summary of median phthalate concentrations in house dust reported in surveys in individual climate zones in China and across the entire country. Panels from the top to bottom show the concentrations of DEHP, DnBP, and DiBP, respectively. The bottom, middle, and top of the boxes represent the 25th, 50th, and 75th percentiles, respectively. Significant differences in dust-phase phthalate concentrations between different zones are labeled on the figure (Mann-Whitney U test; p < 0.05). Herein the whole country is divided into five climate zones in reference to the thermal design code for civil buildings in China (GB50176-2016) [41]. SC, C, HSCW, and HSWW represent SC, C, HSCW, and HSWW climate zones, respectively. Data are missing for the M zone and thus not shown in the figure. Data points are colored by surveys in order of appearance in Table 1.
Current usage metrics show cumulative count of Article Views (full-text article views including HTML views, PDF and ePub downloads, according to the available data) and Abstracts Views on Vision4Press platform.
Data correspond to usage on the plateform after 2015. The current usage metrics is available 48-96 hours after online publication and is updated daily on week days.
Initial download of the metrics may take a while.