Figure 3
Download original image
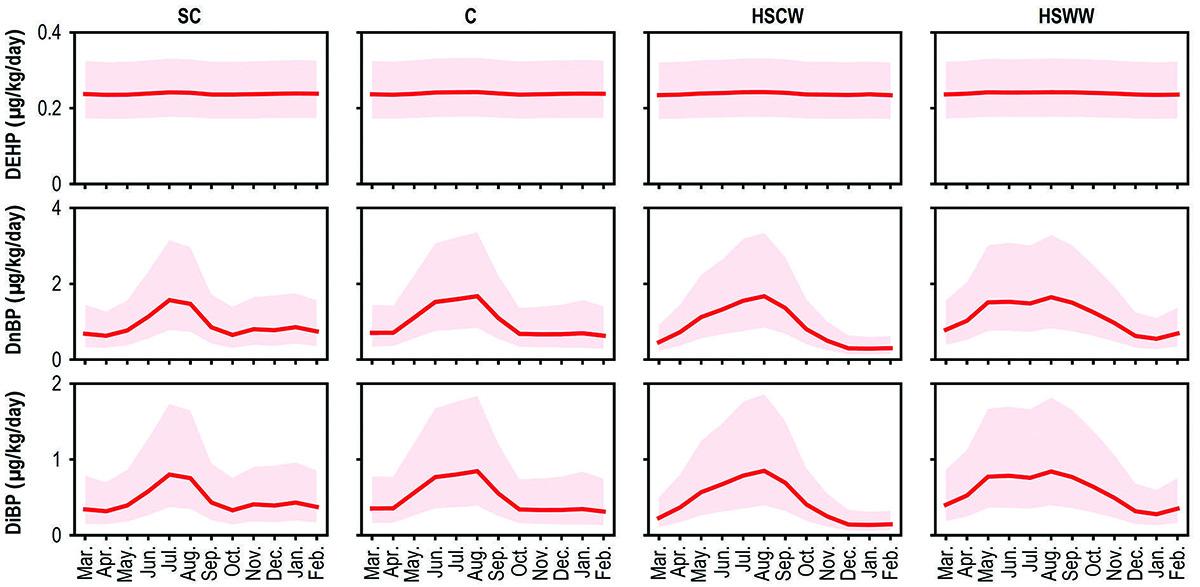
Seasonal patterns of predicted daily intakes of phthalates in individual climate zones. Panels from the top to bottom show daily intake of DEHP, DnBP, and DiBP, respectively. Panels from left to right show results in SC, C, HSCW, and HSWW zones, respectively. The shaded regions represent the interquartile ranges. The dust-phase concentrations of individual compounds are treated as constants across seasons and regions, and thus the variations in exposure doses are caused by the variations in concentrations in the indoor air.
Current usage metrics show cumulative count of Article Views (full-text article views including HTML views, PDF and ePub downloads, according to the available data) and Abstracts Views on Vision4Press platform.
Data correspond to usage on the plateform after 2015. The current usage metrics is available 48-96 hours after online publication and is updated daily on week days.
Initial download of the metrics may take a while.