Figure 4
Download original image
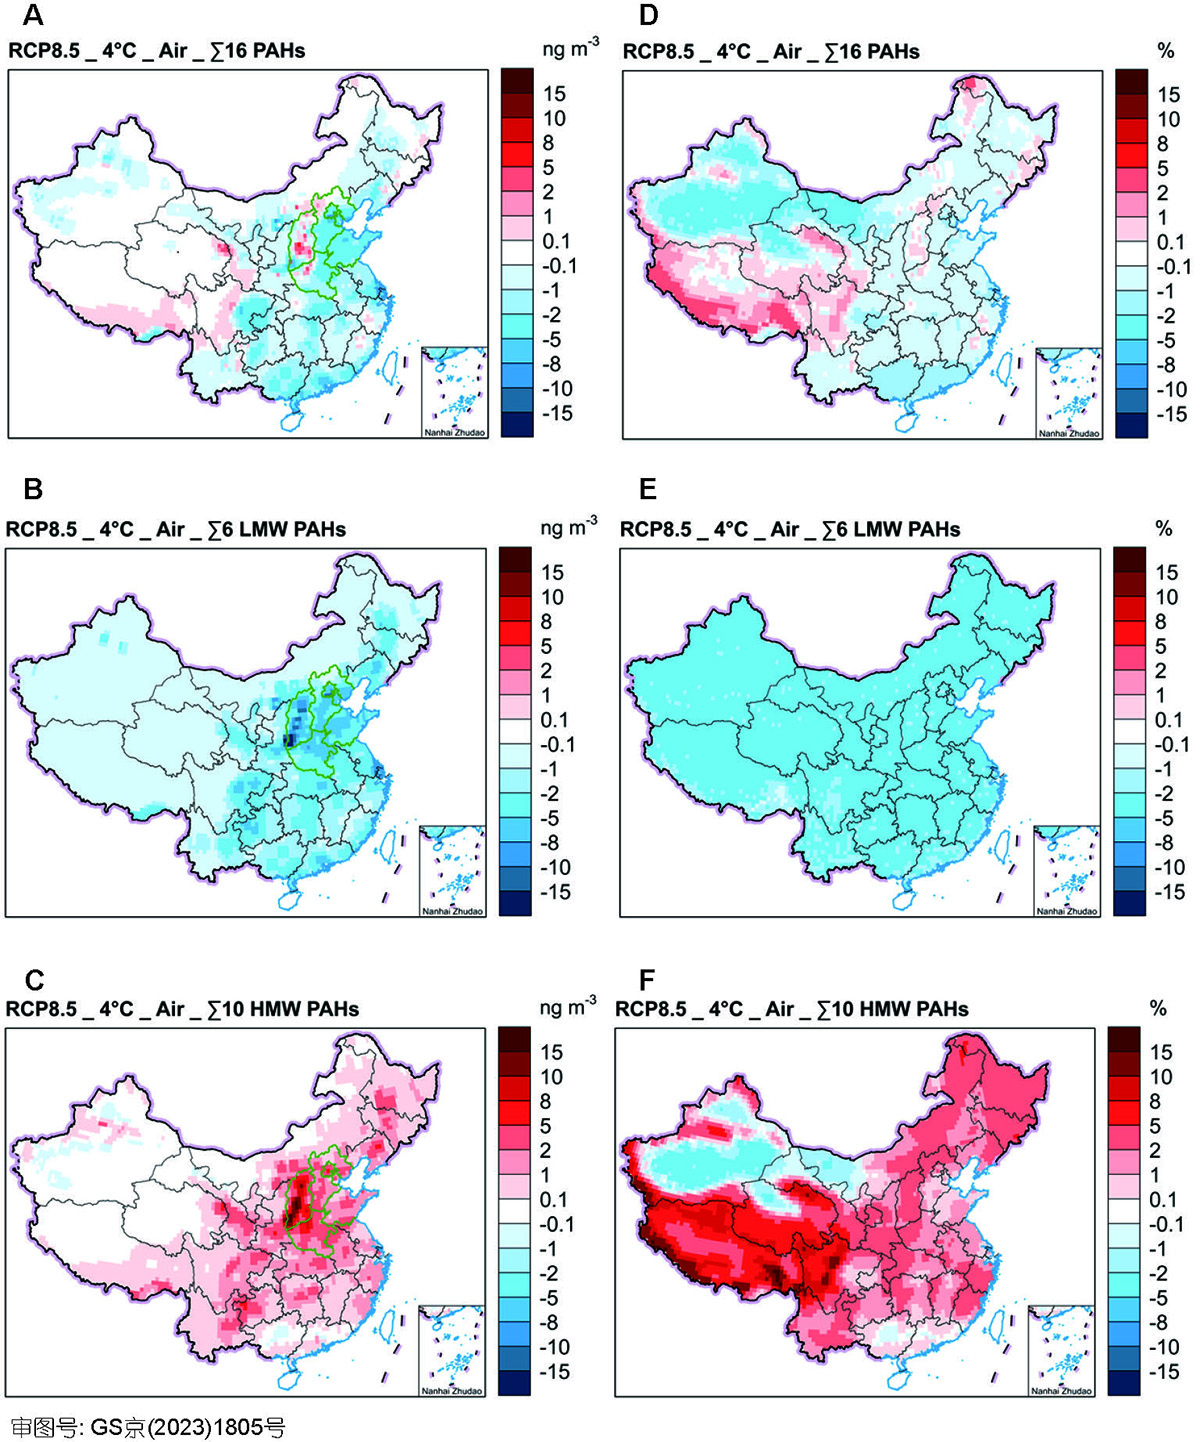
Spatial distribution of change in modelled atmosphere PAHs concentration. The spatial distribution patterns of change in atmospheric concentrations (ng m−3) of (A) 16 PAHs, (B) LMW PAHs, and (C) HMW PAHs, when the temperature rises 4°C under the RCP8.5 scenario. Green lines indicate the provinces and cities where the “2 + 26” cities are located, including Beijing, Tianjin, Hebei, Shanxi, Shandong, and Henan. The spatial distribution patterns of percentage change of atmosphere concentrations (%) of (D) 16 PAHs, (E) LMW PAHs, and (F) HMW PAHs, when the temperature rises 4°C under the RCP8.5 scenario. Data from Hainan and Taiwan are unavailable so that Hainan and Taiwan are uncolored in all the maps.
Current usage metrics show cumulative count of Article Views (full-text article views including HTML views, PDF and ePub downloads, according to the available data) and Abstracts Views on Vision4Press platform.
Data correspond to usage on the plateform after 2015. The current usage metrics is available 48-96 hours after online publication and is updated daily on week days.
Initial download of the metrics may take a while.