Open Access
Figure 5
Download original image
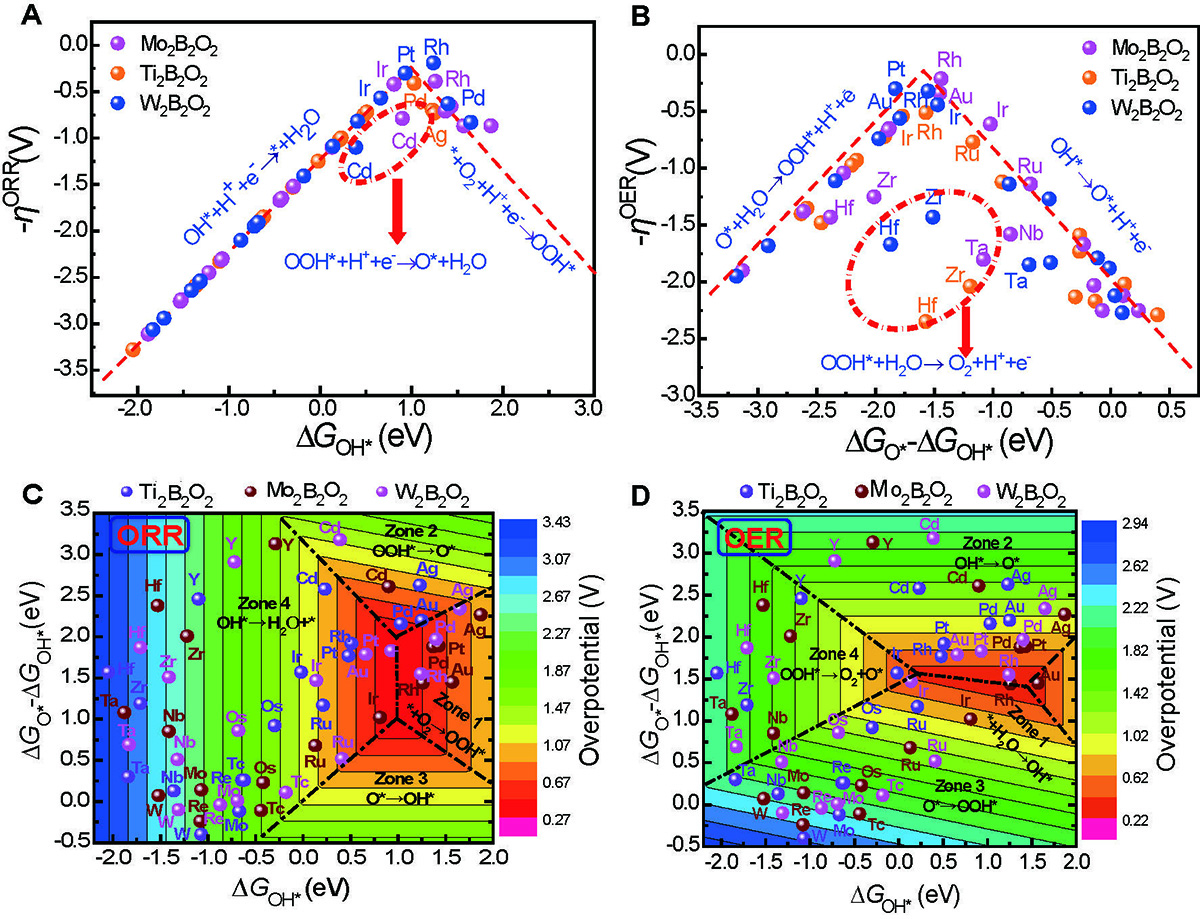
(A) The volcano plot of ΔGOH* versus −ηORR as well as (B) ΔGO* − ΔGOH* versus −ηOER on TM-M2B2O2. The contour maps of (C) ORR and (D) OER catalytic activity on TM-M2B2O2 with ΔGO* − ΔGOH* and ΔGOH* as variables (TM = 4d/5d period atoms; M = Ti, Mo, and W). Here the potential-determining steps are labeled.
Current usage metrics show cumulative count of Article Views (full-text article views including HTML views, PDF and ePub downloads, according to the available data) and Abstracts Views on Vision4Press platform.
Data correspond to usage on the plateform after 2015. The current usage metrics is available 48-96 hours after online publication and is updated daily on week days.
Initial download of the metrics may take a while.