Open Access
Figure 6
Download original image
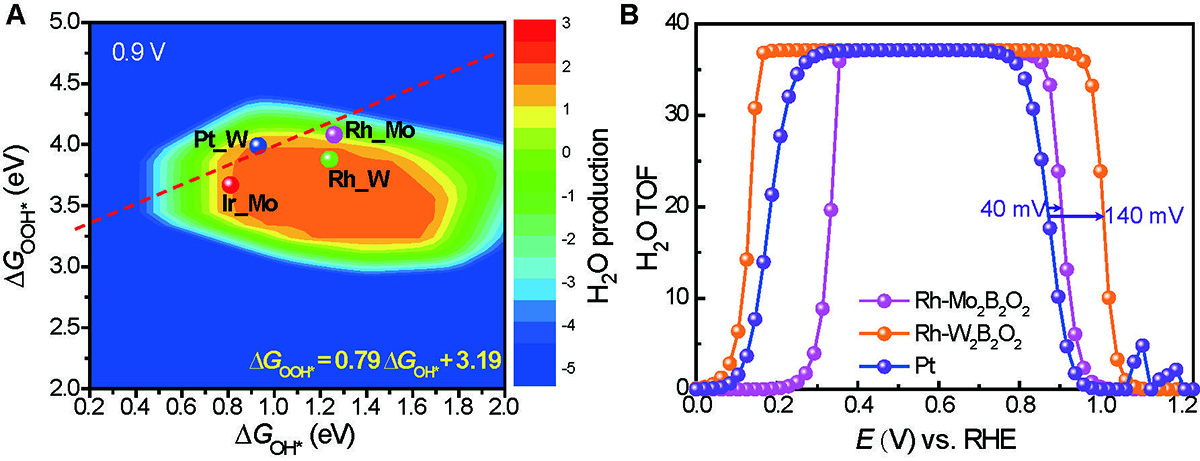
(A) 2D maps of H2O production at 0.9 V using ΔGOH* and ΔGOOH* as variables. (B) The potential-dependent TOFs of H2O production on the pure Pt, Rh-Mo2B2O2 SACs and Rh-W2B2O2 SACs.
Current usage metrics show cumulative count of Article Views (full-text article views including HTML views, PDF and ePub downloads, according to the available data) and Abstracts Views on Vision4Press platform.
Data correspond to usage on the plateform after 2015. The current usage metrics is available 48-96 hours after online publication and is updated daily on week days.
Initial download of the metrics may take a while.