Figure 17
Download original image
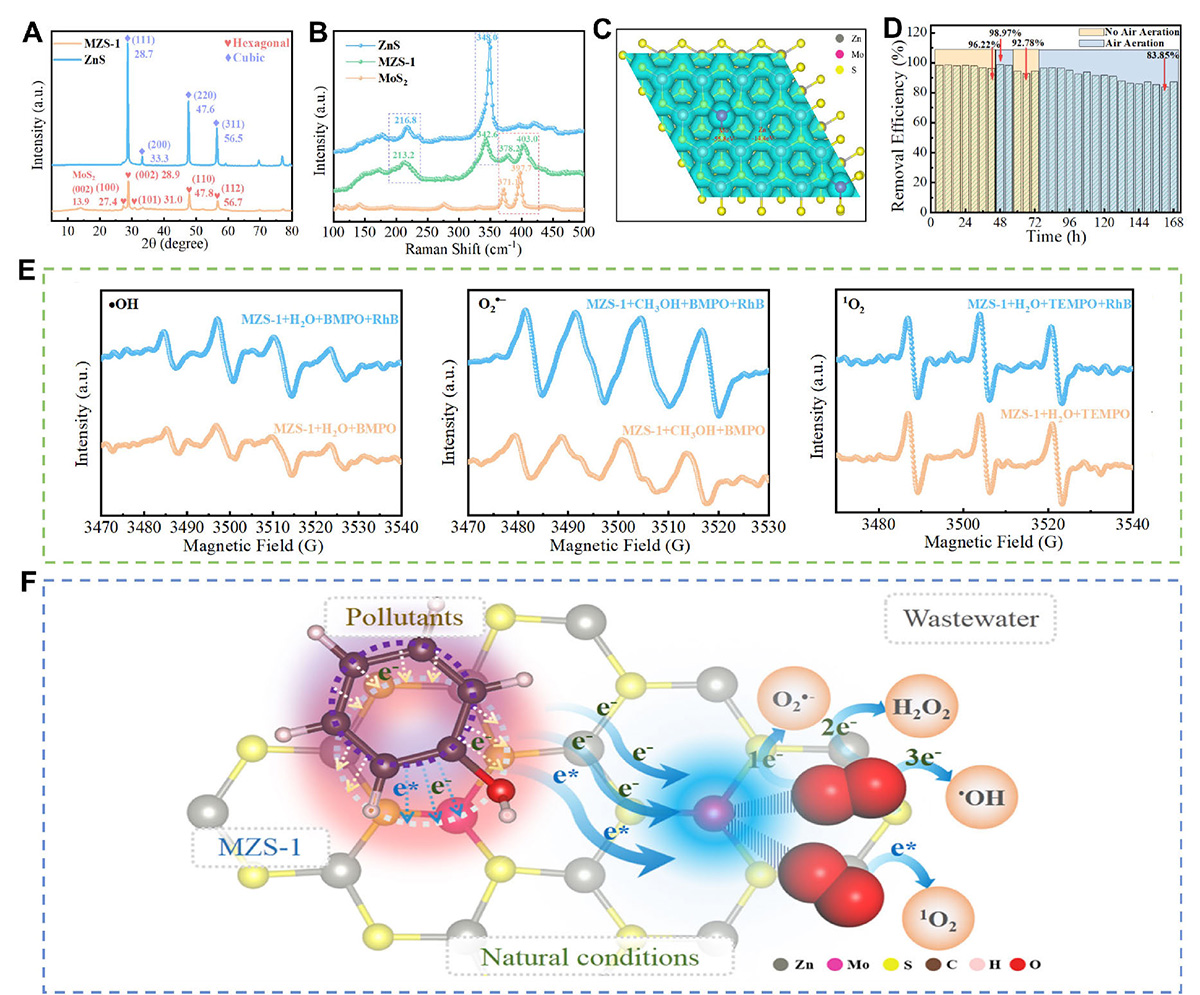
(A) XRD patterns of ZnS and MZS-1. (B) Raman spectra of ZnS, MoS2 and MZS-1. (C) Local potential of MZS-1 by DFT calculation. (D) Stability test of MZS-1 reactor in degrading RhB. (E) EPR spectra for BMPO-•OH, BMPO-O2•− and TEMPO-1O2 in various suspensions. (F) Schematic illustration of sustainable microactivation of DO and ECs conversion on the MZS-1 surface. Adapted with permission from ref. [25], licensed under a Creative Commons Attribution-NonCommercial-NoDerivatives 4.0 International License.
Current usage metrics show cumulative count of Article Views (full-text article views including HTML views, PDF and ePub downloads, according to the available data) and Abstracts Views on Vision4Press platform.
Data correspond to usage on the plateform after 2015. The current usage metrics is available 48-96 hours after online publication and is updated daily on week days.
Initial download of the metrics may take a while.