Figure 8
Download original image
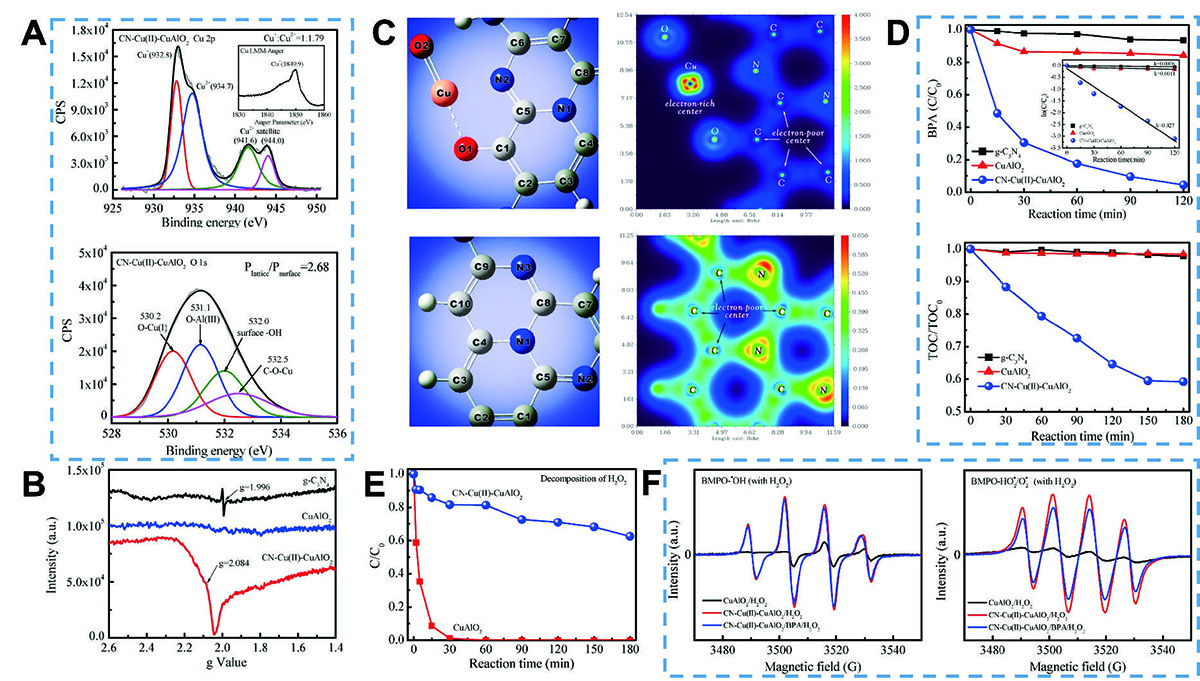
(A) XPS spectra in Cu 2p and O 1s for CN-Cu(II)-CuAlO2. (B) EPR spectra of the fresh g-C3N4, CuAlO2, and CN-Cu(II)-CuAlO2 samples. (C) DFT calculations for the optimized structure (left) and the corresponding two-dimensional valence-electron density color-filled maps (right) of the CN-Cu(II)-CuAlO2 model in -Cu(II)-CN vision fragment and -CN vision fragment. (D) BPA degradation curves in various suspensions with H2O2 (the inset shows the corresponding kinetic curves) and TOC removal curves during BPA degradation. (E) H2O2 decomposition curves during BPA degradation in CuAlO2 and CN-Cu(II)-CuAlO2 suspensions. (F) EPR spectra for •OH and (d) HO2•/O2•− in various suspensions in the presence of H2O2 with and without pollutants. Adapted with permission from ref. [26], Copyright©2018, American Chemical Society.
Current usage metrics show cumulative count of Article Views (full-text article views including HTML views, PDF and ePub downloads, according to the available data) and Abstracts Views on Vision4Press platform.
Data correspond to usage on the plateform after 2015. The current usage metrics is available 48-96 hours after online publication and is updated daily on week days.
Initial download of the metrics may take a while.