Figure 1
Download original image
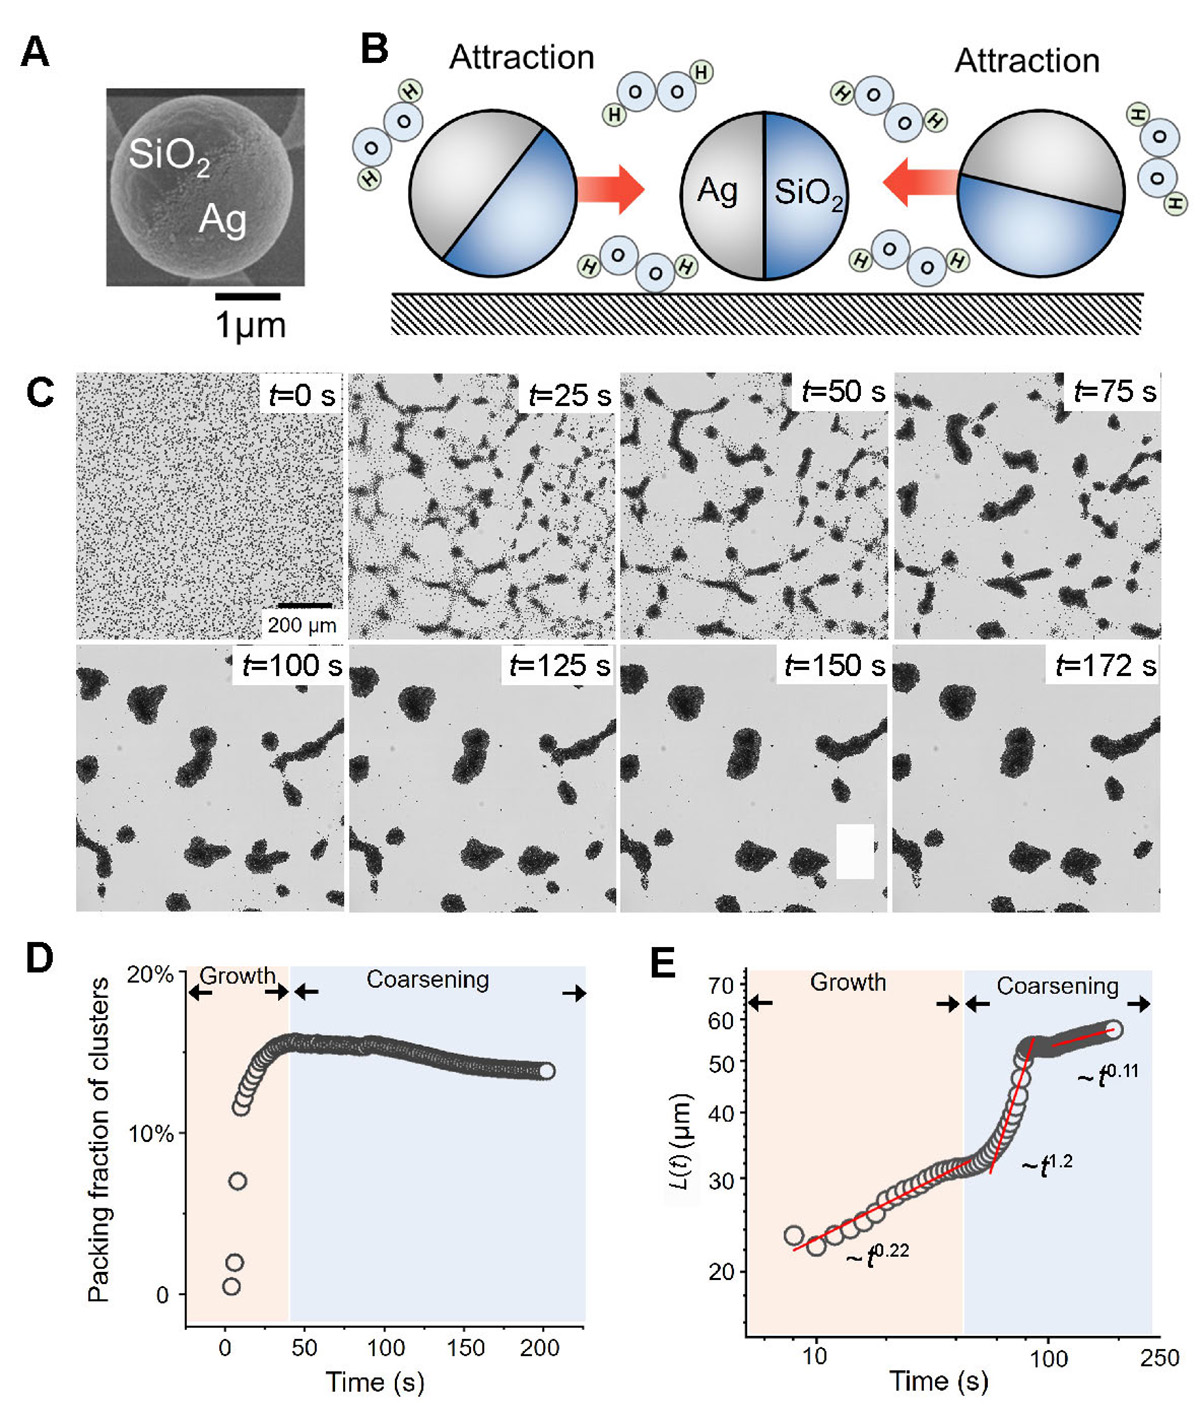
Phase separation of Ag colloids. (A) Scanning electron micrograph of a SiO2-Ag microsphere. (B) SiO2-Ag particles attract each other in dilute H2O2. (C) Optical micrographs of the phase separation of SiO2-Ag (dark) with population density φ = 17% in 0.001 wt% H2O2 aqueous solution. (D) The 2D packing fraction of clusters and (E) the characteristic length of the clusters in (C) as a function of time. The particle density is obtained by identifying the area fraction of the particles by imageJ, see Figure S2 for details. The characteristic length (L) refers to the length corresponding to the first root of the spatial correlation function of the micrographs, see Figure S3 for details. Both the x and y axis in (E) are in log10 scale. Solid red lines in (E) are linear fits.
Current usage metrics show cumulative count of Article Views (full-text article views including HTML views, PDF and ePub downloads, according to the available data) and Abstracts Views on Vision4Press platform.
Data correspond to usage on the plateform after 2015. The current usage metrics is available 48-96 hours after online publication and is updated daily on week days.
Initial download of the metrics may take a while.