Figure 3
Download original image
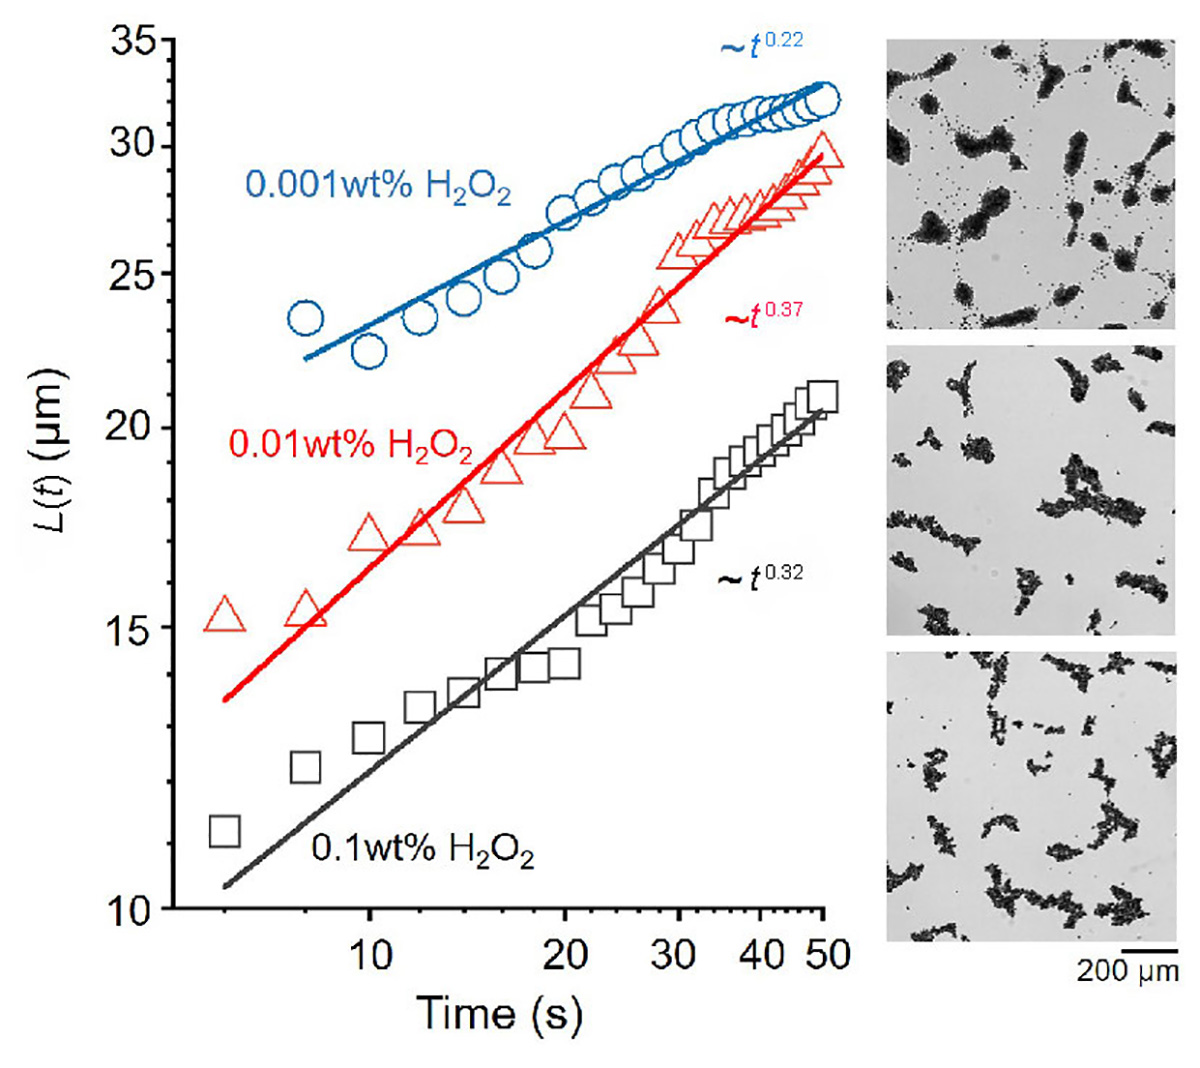
Phase separation of Ag colloids under different H2O2 concentrations. From top to bottom: the kinetics and an optical micrograph (t = 50 s) of the phase separation of Ag colloids (dark) of φ = 17% in 0.001 wt%, 0.01 wt%, 0.1 wt% H2O2 aqueous solutions, respectively. Solid lines are linear fits. Both x and y axes are in log10 scales.
Current usage metrics show cumulative count of Article Views (full-text article views including HTML views, PDF and ePub downloads, according to the available data) and Abstracts Views on Vision4Press platform.
Data correspond to usage on the plateform after 2015. The current usage metrics is available 48-96 hours after online publication and is updated daily on week days.
Initial download of the metrics may take a while.