Figure 3
Download original image
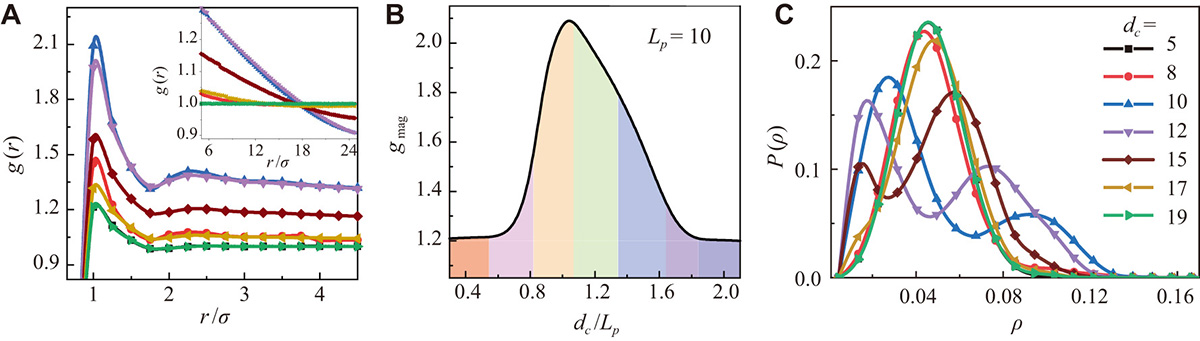
(A) Radial distribution function g(r) for the hard-disc suspension of Figure 2B with different values of dc (see legend in (C)). (B) Maximum amplitude of the g(r) curves in (A), gmaxvs. dc. The color bands denote the different phase topologies as in Figure 2B. (C) Distribution of the local suspension density for the same model parameters as in (A). All curves reported in (A)–(C) have been averaged over 1000 stationary configuration taken 100 time units apart, starting from t=105. The local densities, ρ in (C) have been computed over square bins of side δL=10.
Current usage metrics show cumulative count of Article Views (full-text article views including HTML views, PDF and ePub downloads, according to the available data) and Abstracts Views on Vision4Press platform.
Data correspond to usage on the plateform after 2015. The current usage metrics is available 48-96 hours after online publication and is updated daily on week days.
Initial download of the metrics may take a while.