Figure 7
Download original image
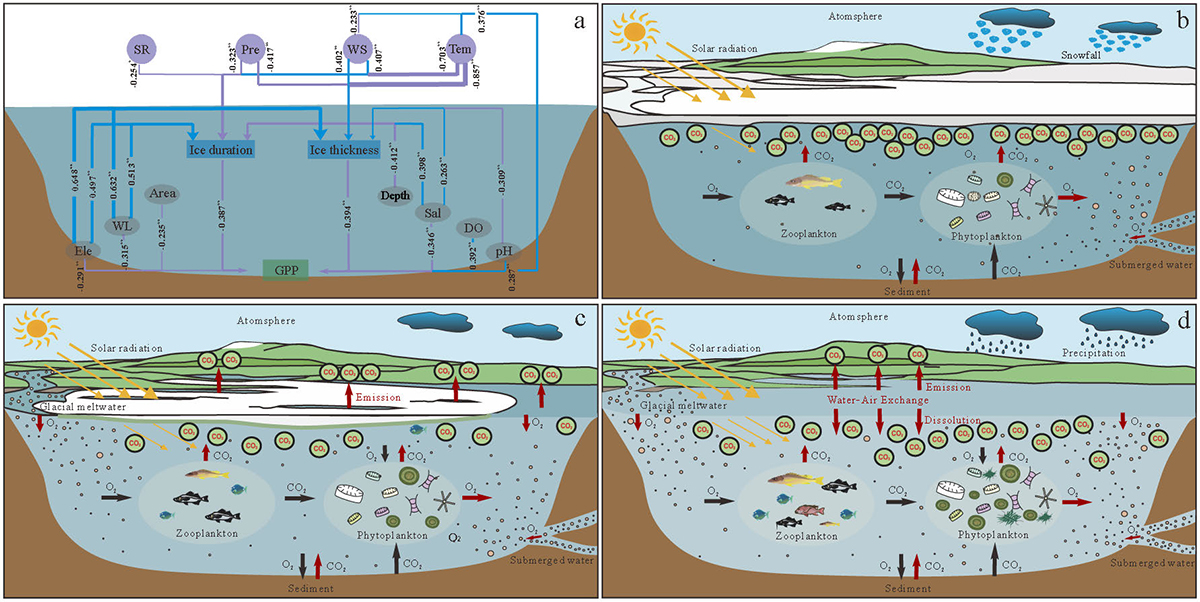
The interaction model of lake ice, GPP and environmental factors on the QTP. (a) represents for spearman correlation analysis of lake ice, GPP, meteorological factors, and physical and chemical factors; (b)–(d) represent lake GPP and CO2 exchange patterns on the QTP under different lake ice cover statuses ((b) where lakes are completely covered by ice; (c) where lake ice calving appears prior to melting; (d) where lake ice has completely melted; red arrows represent gas emissions; black arrows represent gas consumption).
Current usage metrics show cumulative count of Article Views (full-text article views including HTML views, PDF and ePub downloads, according to the available data) and Abstracts Views on Vision4Press platform.
Data correspond to usage on the plateform after 2015. The current usage metrics is available 48-96 hours after online publication and is updated daily on week days.
Initial download of the metrics may take a while.