Figure 3
Download original image
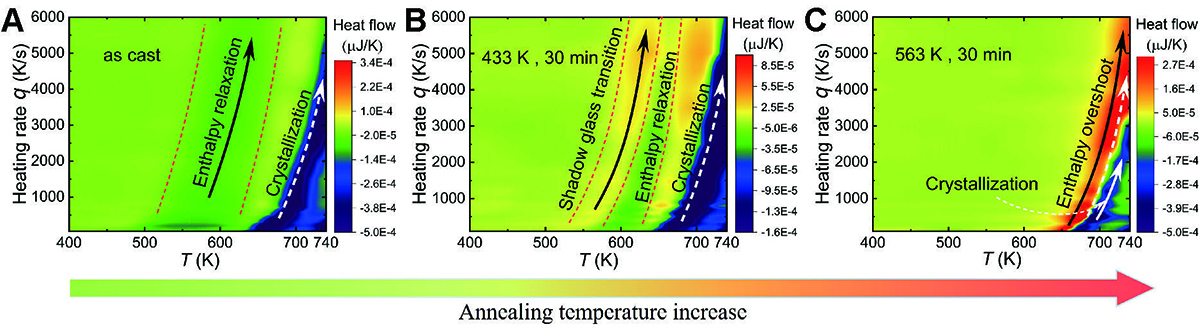
Effects of annealing condition and heating rate on enthalpy relaxation, shadow glass transition, and crystallization for the sample Y63Zr2Cu20Al15 MG. (A), (B), and (C) show the heat flow diagrams of the as-cast sample, the sample annealed at 433 K for 30 min, and the sample annealed at 563 K for 30 min, respectively. They have the same horizontal coordinate, i.e., heating from 400 K to 740 K. The heating rates are both from 100 K/s to 6000 K/s.
Current usage metrics show cumulative count of Article Views (full-text article views including HTML views, PDF and ePub downloads, according to the available data) and Abstracts Views on Vision4Press platform.
Data correspond to usage on the plateform after 2015. The current usage metrics is available 48-96 hours after online publication and is updated daily on week days.
Initial download of the metrics may take a while.