Figure 2
Download original image
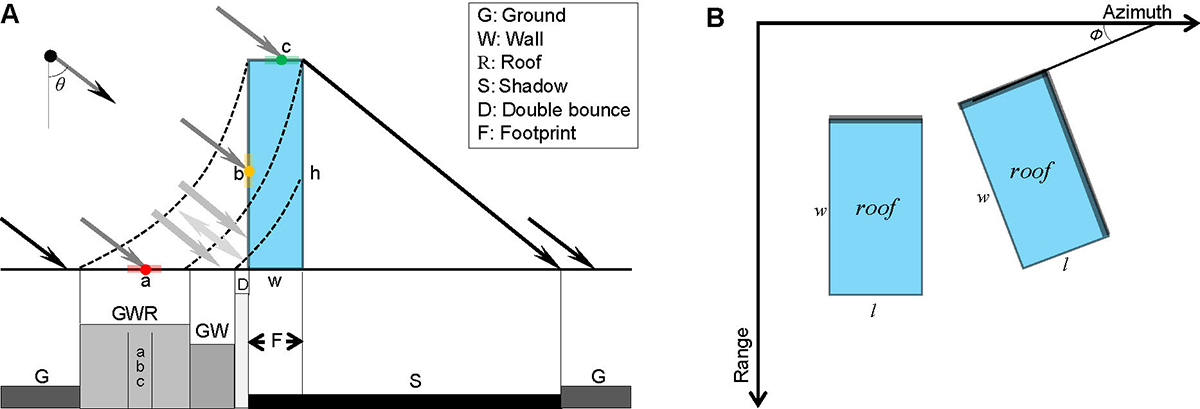
Intensity difference in a SAR image. (A) Different imaging regions with different intensities (different structures with the same slant range are imaged into the same region); (B) facades with different directions (black line segments) producing salient double-bounce regions indicated as D in (A).
Current usage metrics show cumulative count of Article Views (full-text article views including HTML views, PDF and ePub downloads, according to the available data) and Abstracts Views on Vision4Press platform.
Data correspond to usage on the plateform after 2015. The current usage metrics is available 48-96 hours after online publication and is updated daily on week days.
Initial download of the metrics may take a while.