Figure 1
Download original image
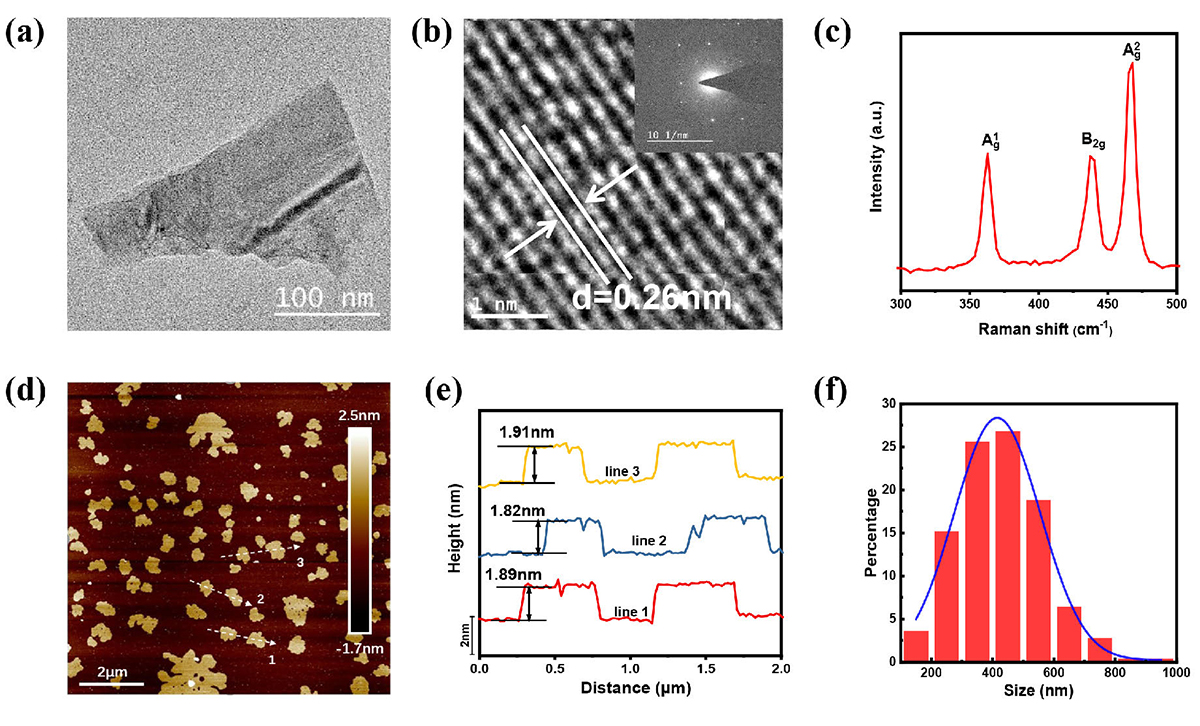
Characterization of the prepared BP. (a) TEM image of few-layered BP. (b) HRTEM image of BP. The inset image showed the corresponding SAED pattern. (c) Raman spectrum of BP. (d) AFM image of BP. (e) The height profiles of BP along the white lines in (c). (f) Histogram of BP size distribution. The histograms were developed by counting 200 sheets for each sample, with Gaussian fit curves shown in each histogram.
Current usage metrics show cumulative count of Article Views (full-text article views including HTML views, PDF and ePub downloads, according to the available data) and Abstracts Views on Vision4Press platform.
Data correspond to usage on the plateform after 2015. The current usage metrics is available 48-96 hours after online publication and is updated daily on week days.
Initial download of the metrics may take a while.