Figure 3
Download original image
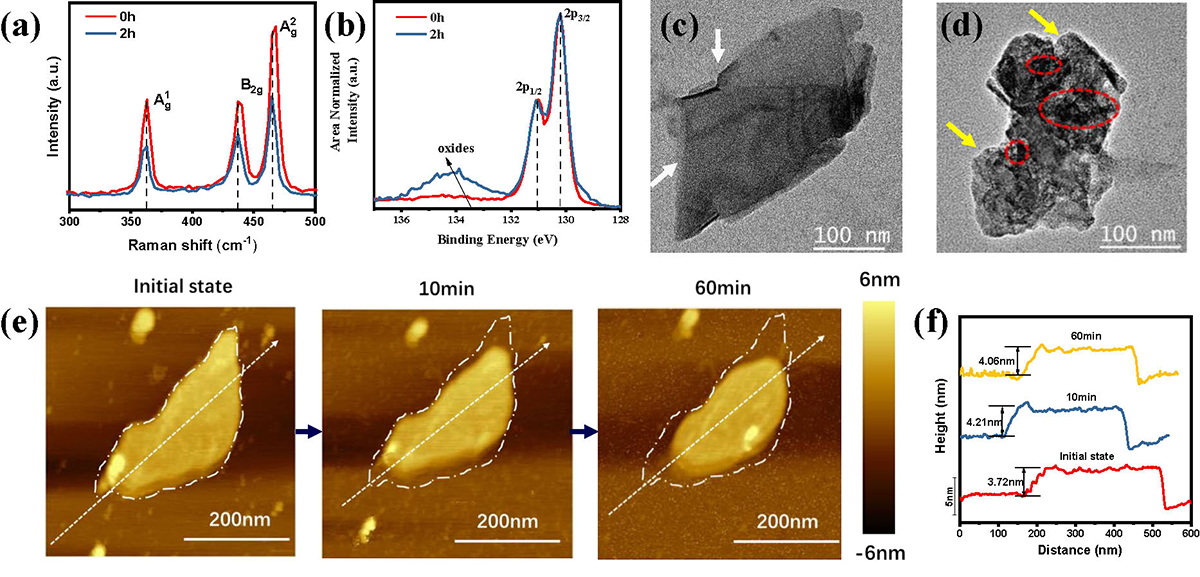
Characterization of BP during the reaction. (a) Raman spectra of BP in 20 μmol/L Cu2+ solution at 0 and 2 h. (b) XPS spectra of BP exposed to Cu2+. The morphology of the BP sheet at 0 h (c) and 2 h (d) after reaction with Cu2+. The white tip indicates the complete edge of the BP sheet. The yellow tip indicates the rounded edge after partial oxidation, and the red circle indicates the black spots loaded on the surface of BP. (e) In situ AFM images acquired with Cu2+ at different times, showing the morphology evolution of a BP sheet. (f) Height profiles of the BP nanoflake acquired along the dashed lines in panel (e).
Current usage metrics show cumulative count of Article Views (full-text article views including HTML views, PDF and ePub downloads, according to the available data) and Abstracts Views on Vision4Press platform.
Data correspond to usage on the plateform after 2015. The current usage metrics is available 48-96 hours after online publication and is updated daily on week days.
Initial download of the metrics may take a while.