Figure 5
Download original image
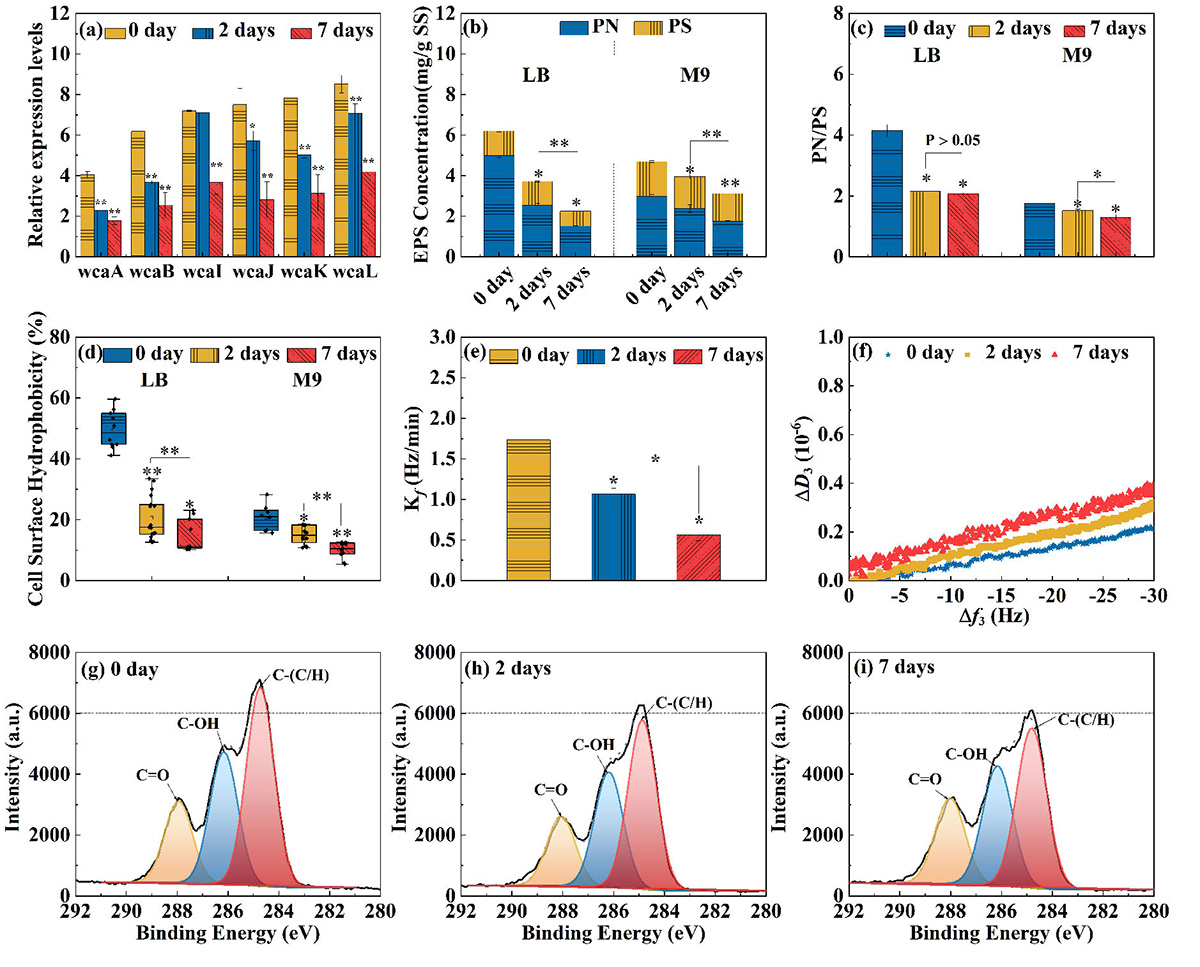
Relative expression levels of six genes of exopolysaccharides biosynthesis pathway in E. coli MG1655 without and with the starvation for 2 and 7 days (a); the protein (blue columns) and polysaccharide (yellow columns) contents of EPS from E.coli MG1655 without and with the starvation for 2 and 7 days (b); the ratio of protein (PN) and polysaccharide (PS) of EPS from E. coli MG1655 without and with the starvation for 2 and 7 days (c); surface hydrophobicity of E.coli MG1655 without and with the starvation for 2 and 7 days using MATH text (d); deposition efficiencies of EPS from E.coli MG1655 without and with the starvation for 2 and 7 days (e); variations in dissipation as a function of frequency shifts of EPS from E.coli MG1655 without and with the starvation for 2 and 7 days (f); high-resolution C 1s XPS spectra of EPS from E.coli MG1655 without and with the starvation for 2 and 7 days. Error bar indicates standard deviation of measurements (n ≥ 3). The significant differences are indicated with *P < 0.05, **P < 0.01.
Current usage metrics show cumulative count of Article Views (full-text article views including HTML views, PDF and ePub downloads, according to the available data) and Abstracts Views on Vision4Press platform.
Data correspond to usage on the plateform after 2015. The current usage metrics is available 48-96 hours after online publication and is updated daily on week days.
Initial download of the metrics may take a while.