Figure 3
Download original image
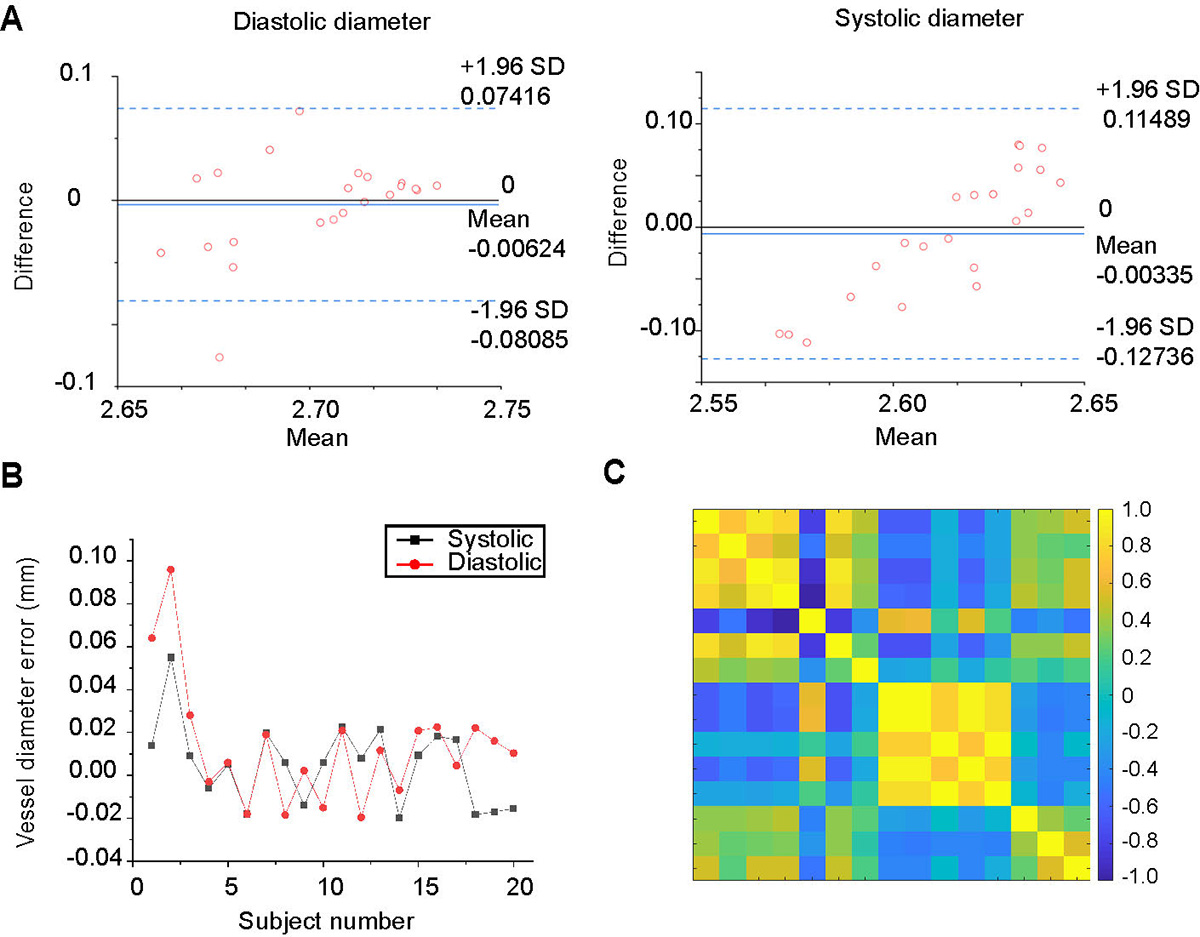
Measurement of vessel diameter and feature selection results. (A) Bland-Altman diagram of systolic and diastolic vessel diameter error (n=22). (B) Diameter measurement error across different individuals (n=20). (C) Pearson correlation matrix, where the parameters are SBP, DBP, HR, T1, T2, Tac, Tcd, H1, H2, K0, K1, K2, MD, SD, WE, from top to bottom and left to right.
Current usage metrics show cumulative count of Article Views (full-text article views including HTML views, PDF and ePub downloads, according to the available data) and Abstracts Views on Vision4Press platform.
Data correspond to usage on the plateform after 2015. The current usage metrics is available 48-96 hours after online publication and is updated daily on week days.
Initial download of the metrics may take a while.