Figure 2
Download original image
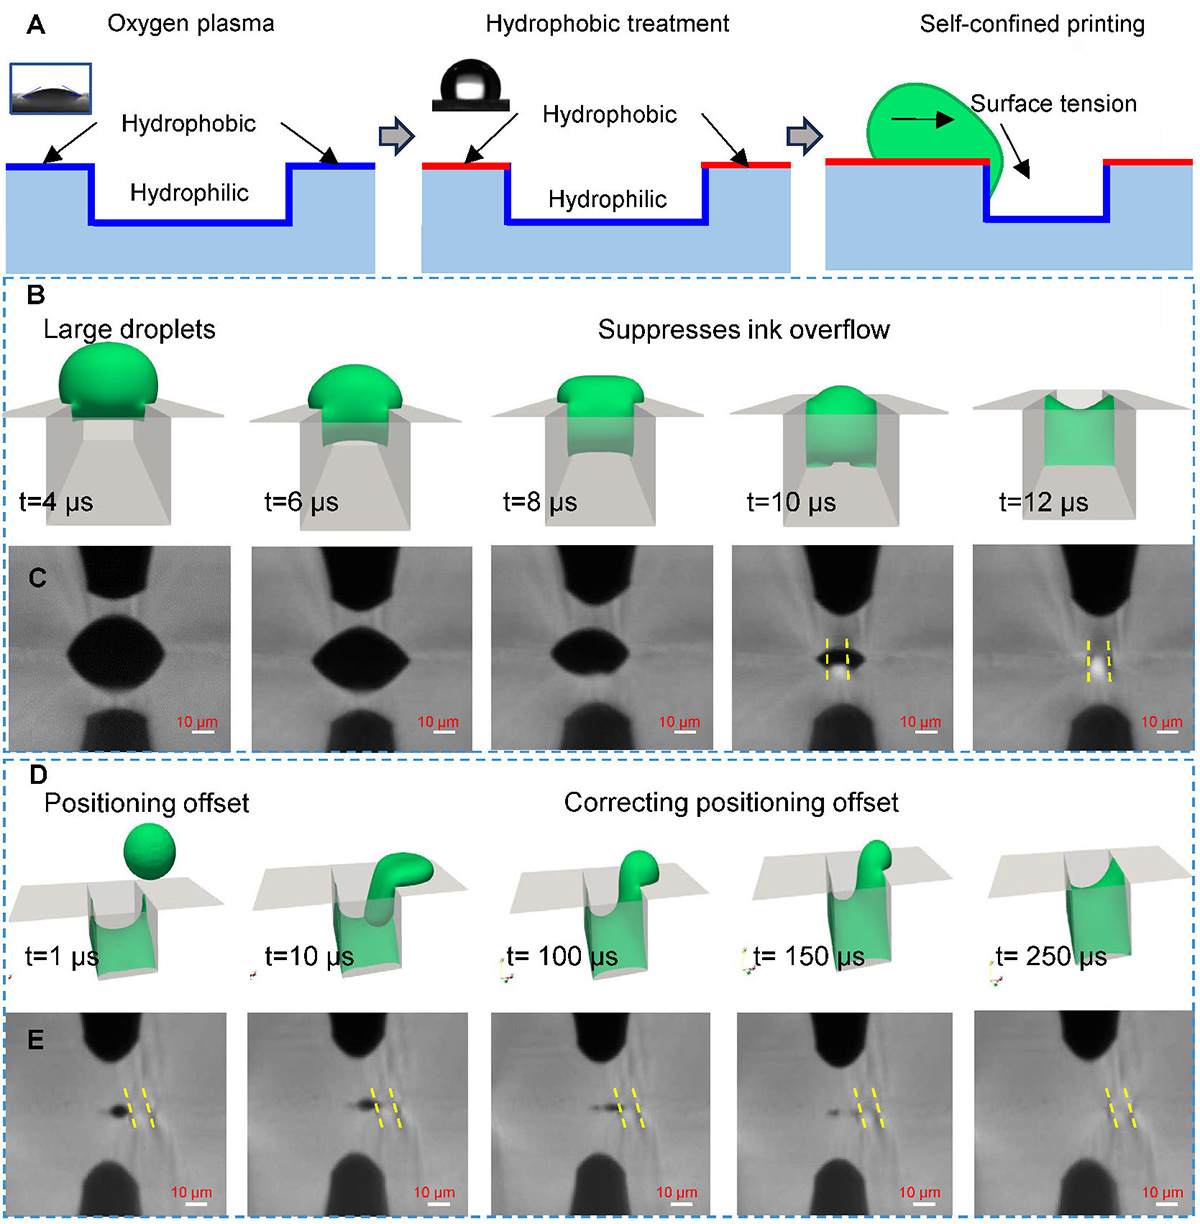
Numerical simulations and experimental verifications of self-confined printing of droplets on microgroove surfaces. (A) Schematic representation of the local hydrophilic and hydrophobic treatment; (B), (C) numerical simulation and experimental phenomenon when the droplet diameter exceeds the groove width; (D), (E) numerical simulation and experimental phenomenon when the droplet deposition position deviates from the groove. The yellow dotted line in the figure represents the groove edge line.
Current usage metrics show cumulative count of Article Views (full-text article views including HTML views, PDF and ePub downloads, according to the available data) and Abstracts Views on Vision4Press platform.
Data correspond to usage on the plateform after 2015. The current usage metrics is available 48-96 hours after online publication and is updated daily on week days.
Initial download of the metrics may take a while.