Figure 3
Download original image
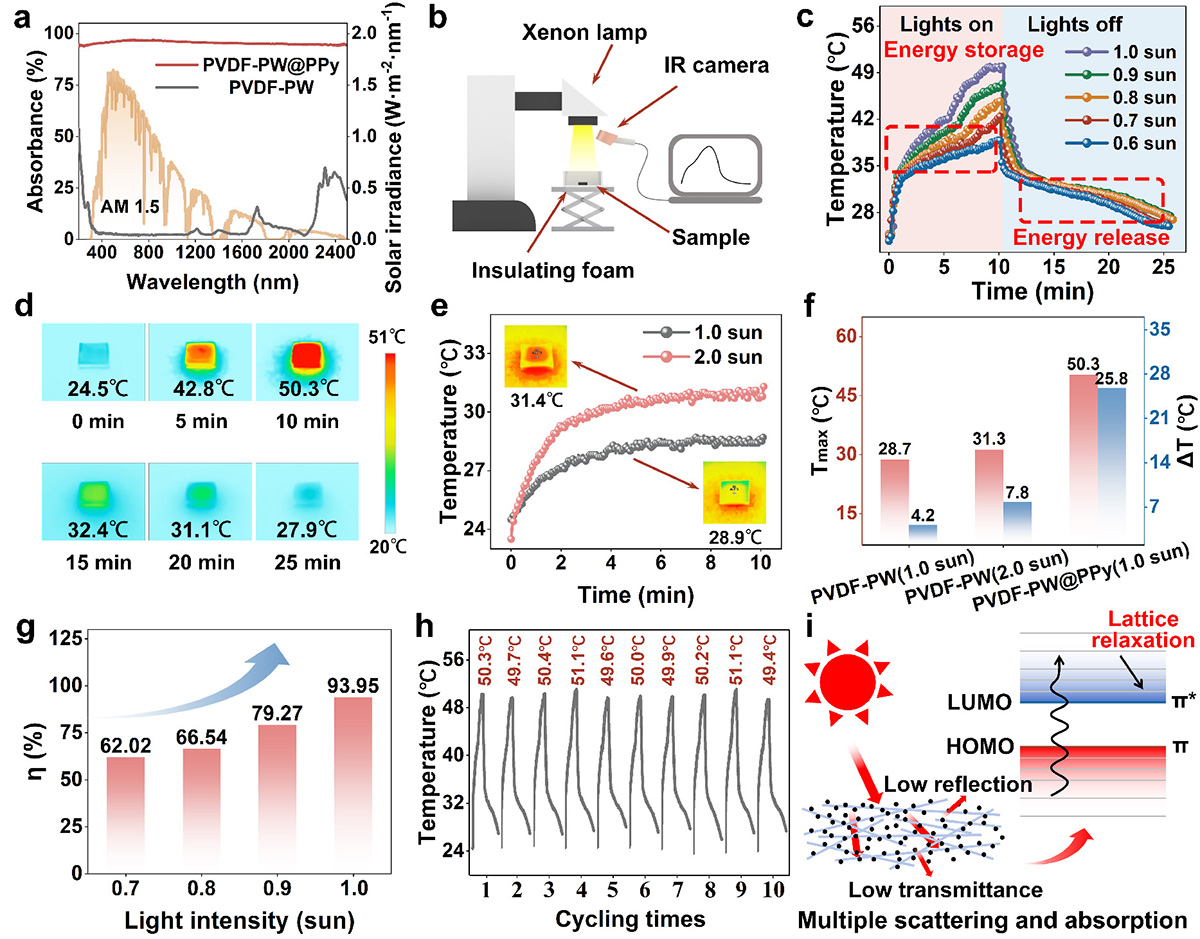
Solar-to-thermal conversion testing of PVDF-PW@PPy. (a) Absorbance of the composite film. (b) Schematic diagram of the solar-to-thermal conversion testing device. (c) Temperature curves of PVDF-PW@PPy under different light intensities. (d) Partial infrared thermal imaging during testing. (e) Temperature curves under 1.0 and 2.0 sun light intensities. (f) Maximum temperature and temperature difference under different test conditions. (g) Solar-to-thermal conversion efficiency under different light intensities. (h) Temperature curves of the composite film under ten continuous photothermal conversion tests. (i) Solar-to-thermal conversion mechanism.
Current usage metrics show cumulative count of Article Views (full-text article views including HTML views, PDF and ePub downloads, according to the available data) and Abstracts Views on Vision4Press platform.
Data correspond to usage on the plateform after 2015. The current usage metrics is available 48-96 hours after online publication and is updated daily on week days.
Initial download of the metrics may take a while.