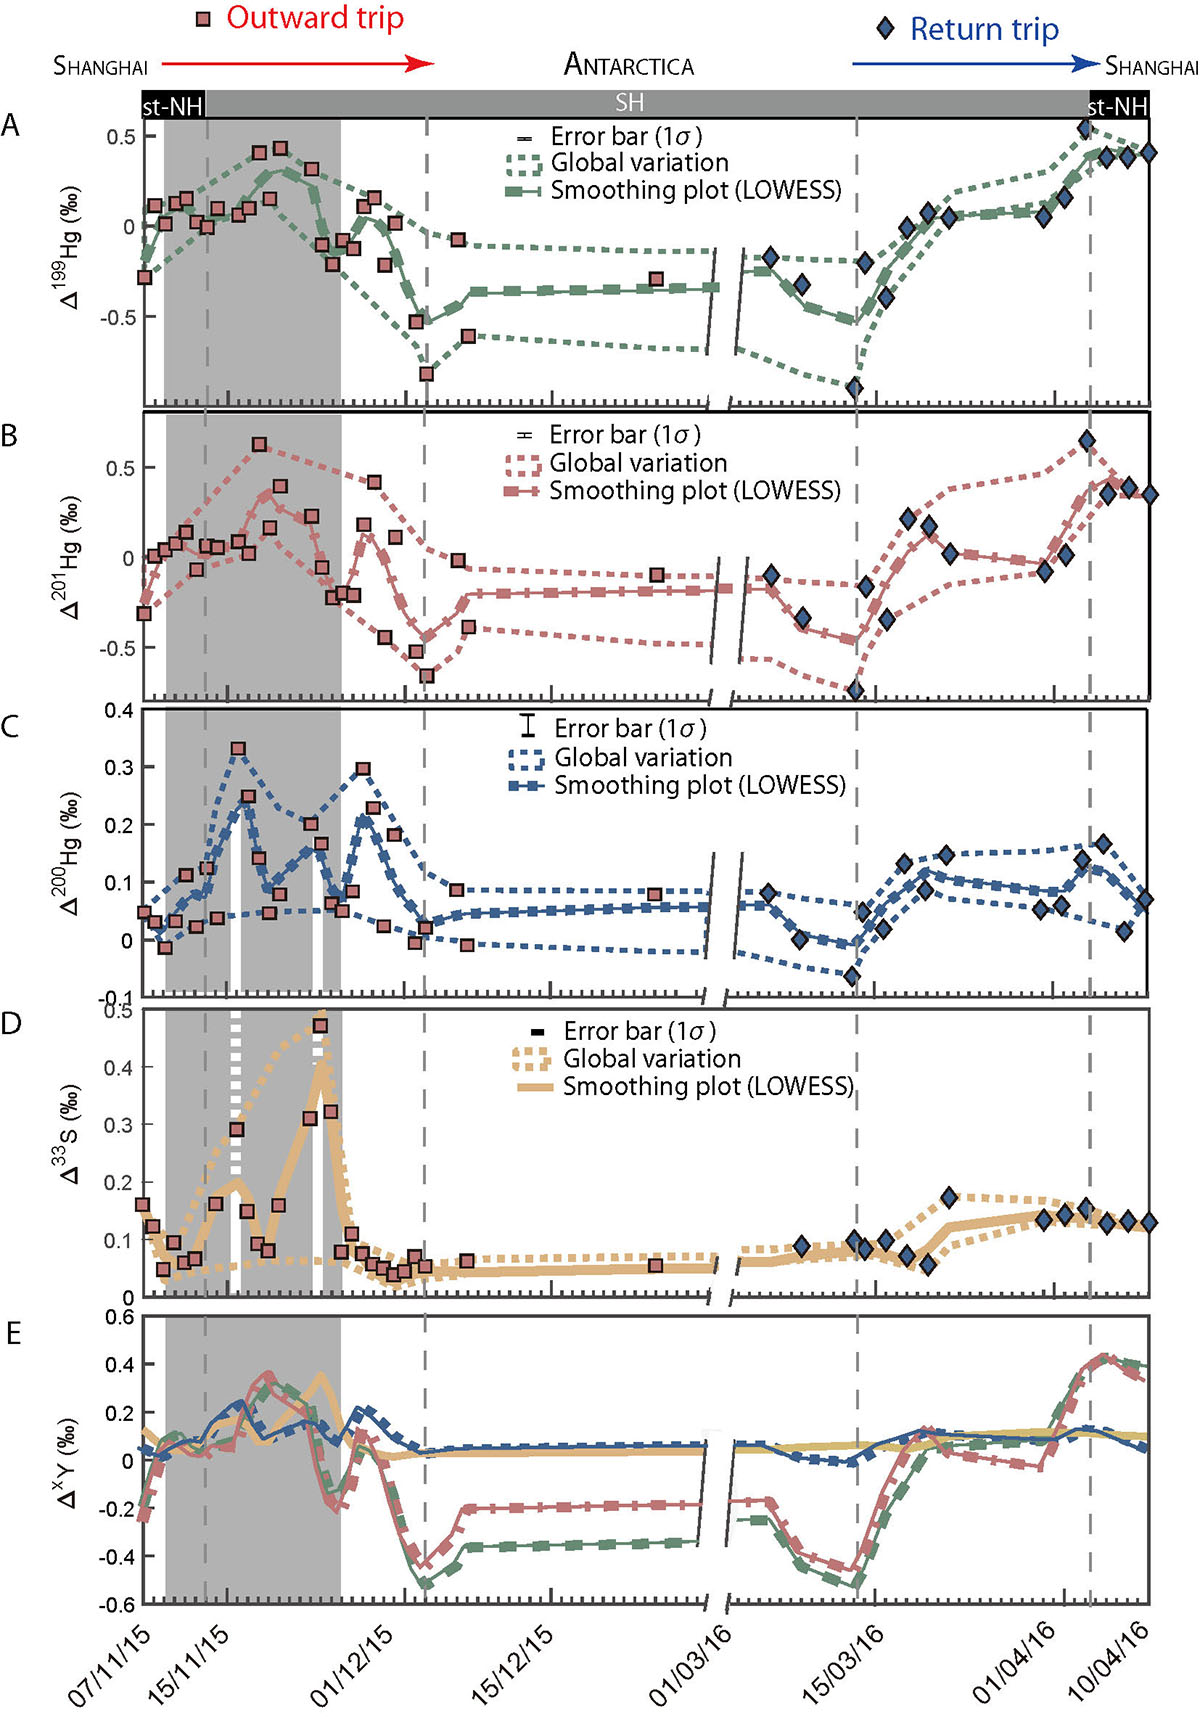
Figure 3
Download original image
Variation of the (A) Δ 199Hg, (B) Δ 201Hg, (C) Δ 200Hg and (D) Δ 33S function of the sampling date. Smoothing plots (LOWESS) are also represented for each. (E) Compilation of the calculated smoothing plot function of the sampling date. Period with positive excursions highlighted with white strokes is represented by the grey rectangular.
Current usage metrics show cumulative count of Article Views (full-text article views including HTML views, PDF and ePub downloads, according to the available data) and Abstracts Views on Vision4Press platform.
Data correspond to usage on the plateform after 2015. The current usage metrics is available 48-96 hours after online publication and is updated daily on week days.
Initial download of the metrics may take a while.