Figure 1
Download original image
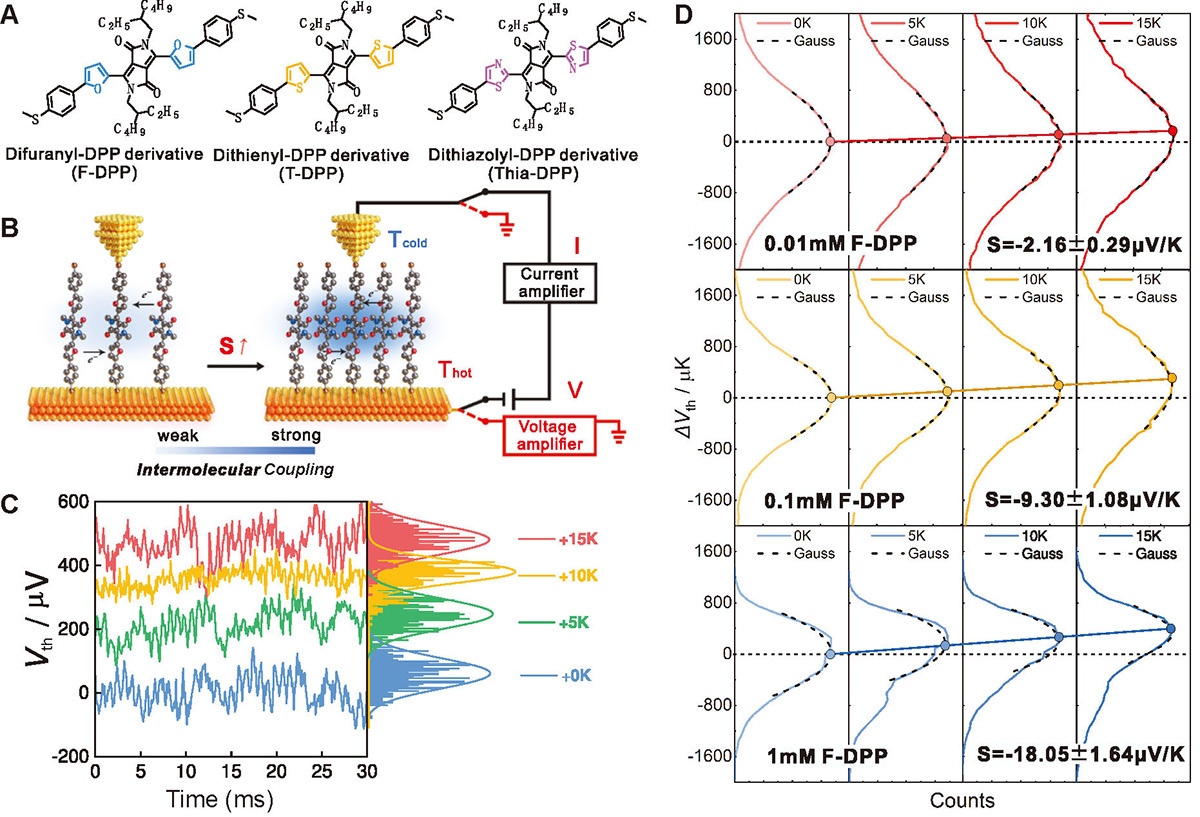
Schematic diagram of experimental setup and Seebeck coefficient measurement. (A) Molecular structures of DPP derivatives studied in this work. (B) Schematic of the experimental setup. Closely packed molecules enhance the Seebeck coefficient due to stronger intermolecular coupling. (C) Typical measured individual thermovoltage traces and histograms for single F-DPP molecule with 1 mmol/L immersion concentration at a series of ΔT (0, 5, 10, and 15 K). (D) Histograms of single F-DPP molecule thermoelectric voltage measurements with different immersion concentrations (0.01, 0.1, 1 mmol/L). Gaussian fits were plotted in a black dash curve. The horizontal black dash line indicates the baseline of thermoelectric voltage at ΔVth=0. The Seebeck coefficients were obtained from the thermovoltage as a function of ΔT. Solid lines are linear fitting.
Current usage metrics show cumulative count of Article Views (full-text article views including HTML views, PDF and ePub downloads, according to the available data) and Abstracts Views on Vision4Press platform.
Data correspond to usage on the plateform after 2015. The current usage metrics is available 48-96 hours after online publication and is updated daily on week days.
Initial download of the metrics may take a while.