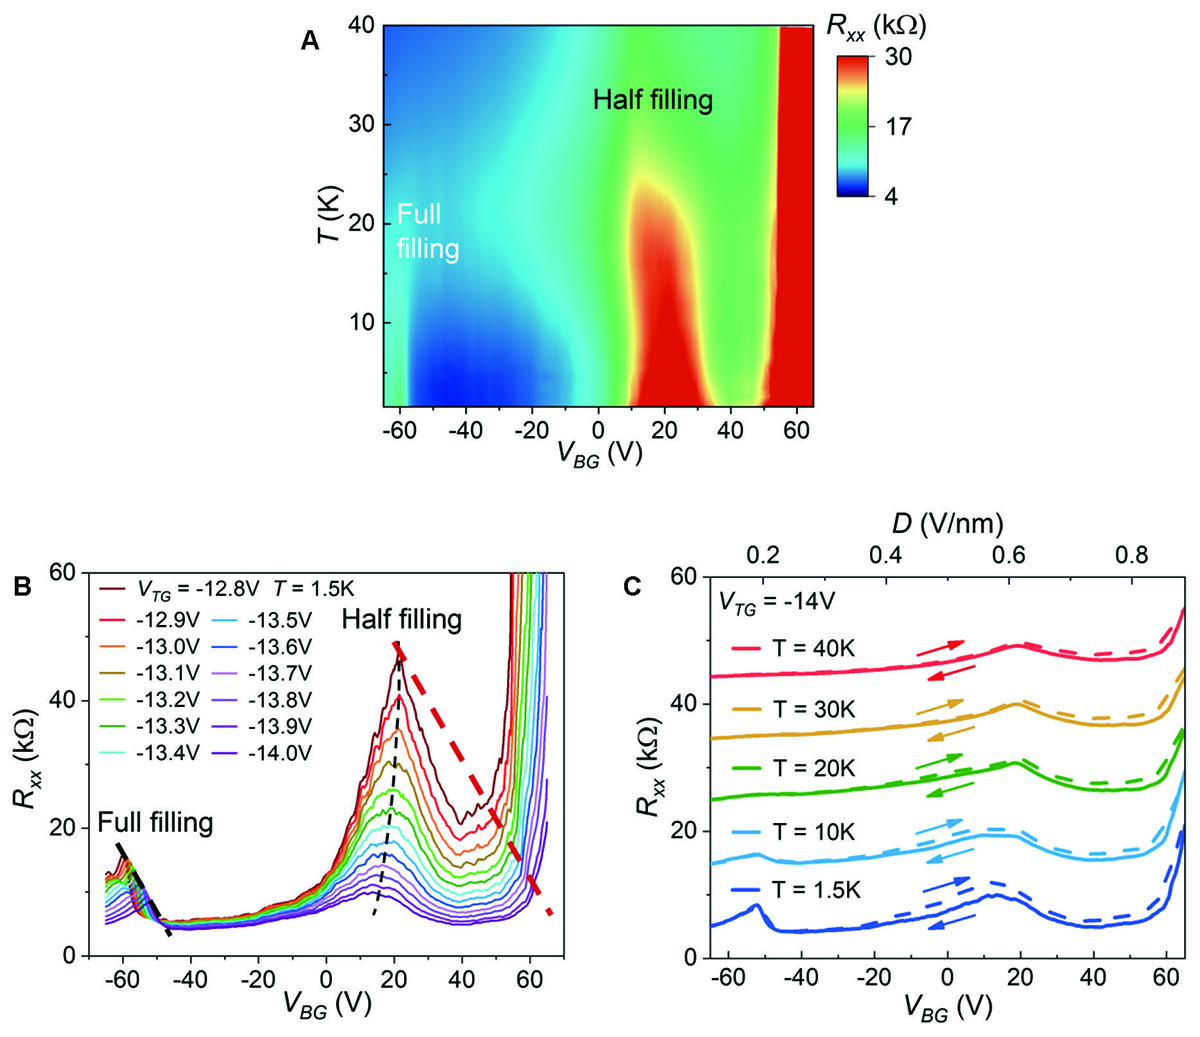
Figure 4
Download original image
(A) Phase diagram plotted based on transport measurement. The half filling states gradually disappear when temperature is higher than 40 K. (B) Displacement field effects (by setting VTG at different voltages and scanning VBG) on the full filling and half filling states. The full and half filling states behave differently by changing the displacement fields. The black/red thick dashed lines indicate the ideal full/half filling peak positions. The black thin dashed line indicates the peak positions of half filling states measured. (C) Temperature dependence of the resistance hysteresis. The hysteresis loops gradually disappear at about 40 K.
Current usage metrics show cumulative count of Article Views (full-text article views including HTML views, PDF and ePub downloads, according to the available data) and Abstracts Views on Vision4Press platform.
Data correspond to usage on the plateform after 2015. The current usage metrics is available 48-96 hours after online publication and is updated daily on week days.
Initial download of the metrics may take a while.