Figure 3
Download original image
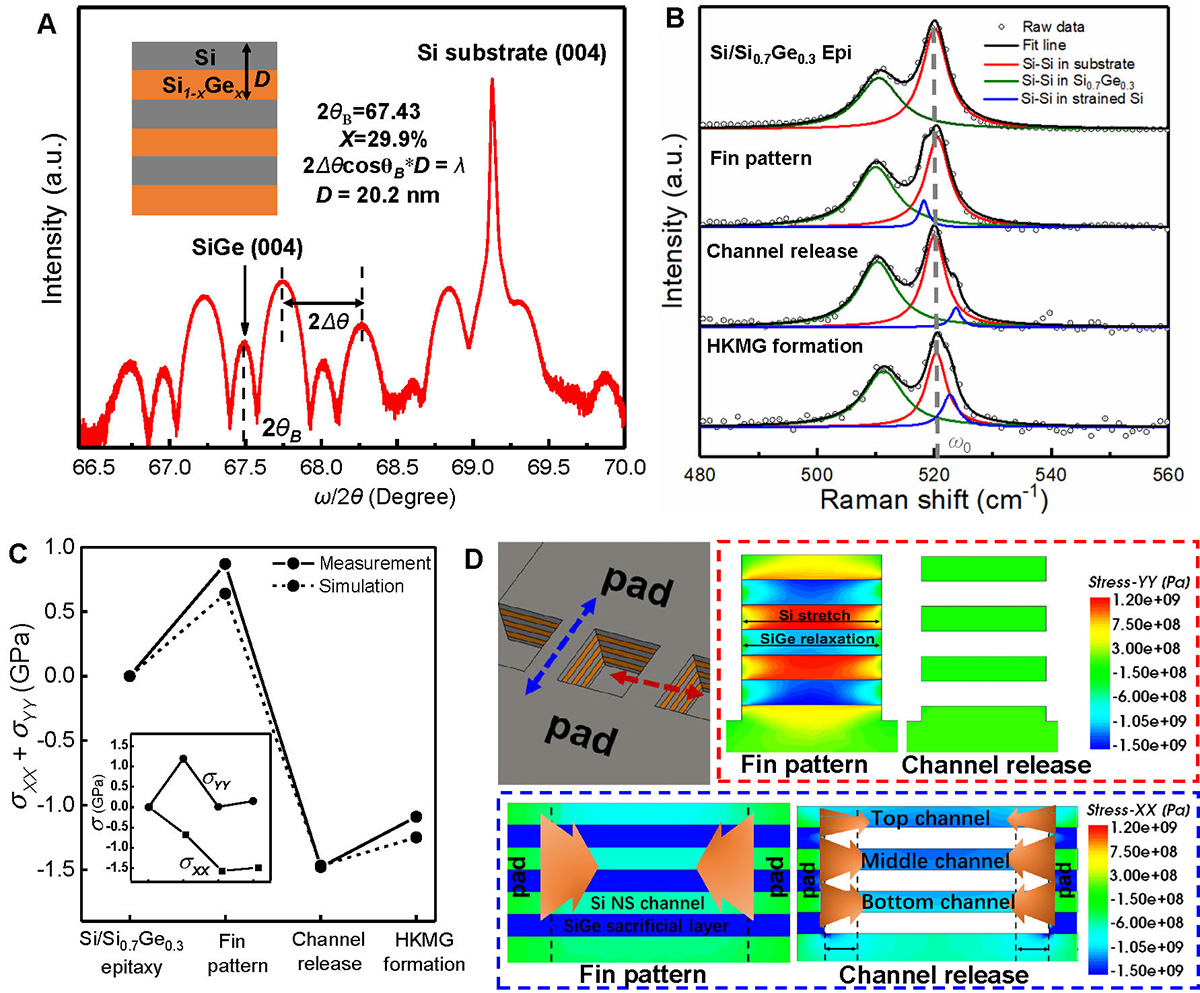
(A) Measured rocking curves for the Si/Si0.7Ge0.3 stacked layers on Si substrates on the (004) surface. (B) Raman spectra deconvolution by Lorentz fitting at different process steps with substrate Si peak located at 520.2 cm−1. (C) The measured and simulated σXX+σYY stress evolution comparison along the fabrication process. The inset was the simulated stress components of σXX and σYY along X and Y directions. (D) σXX and σYY distribution in channel and pad regions. The section was along and perpendicular to the channel direction.
Current usage metrics show cumulative count of Article Views (full-text article views including HTML views, PDF and ePub downloads, according to the available data) and Abstracts Views on Vision4Press platform.
Data correspond to usage on the plateform after 2015. The current usage metrics is available 48-96 hours after online publication and is updated daily on week days.
Initial download of the metrics may take a while.