Figure 3
Download original image
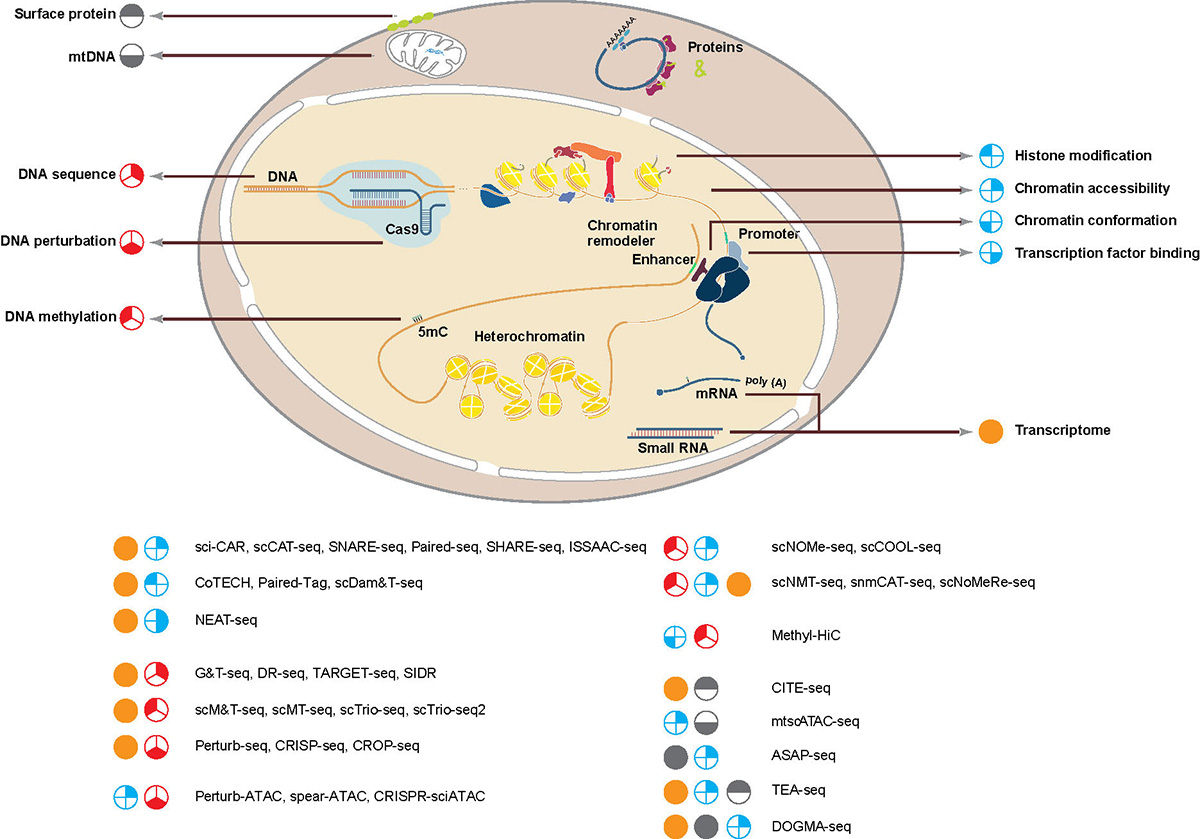
Methods for single-cell multimodal Omics analysis. Top: schematics of modalities in the cell. Different modalities are highlighted by different colored circles. Bottom: different combinations of colored circles stand for the modalities profiled in the corresponding technologies. References for these methods are as listed in Table 1.
Current usage metrics show cumulative count of Article Views (full-text article views including HTML views, PDF and ePub downloads, according to the available data) and Abstracts Views on Vision4Press platform.
Data correspond to usage on the plateform after 2015. The current usage metrics is available 48-96 hours after online publication and is updated daily on week days.
Initial download of the metrics may take a while.