Figure 6
Download original image
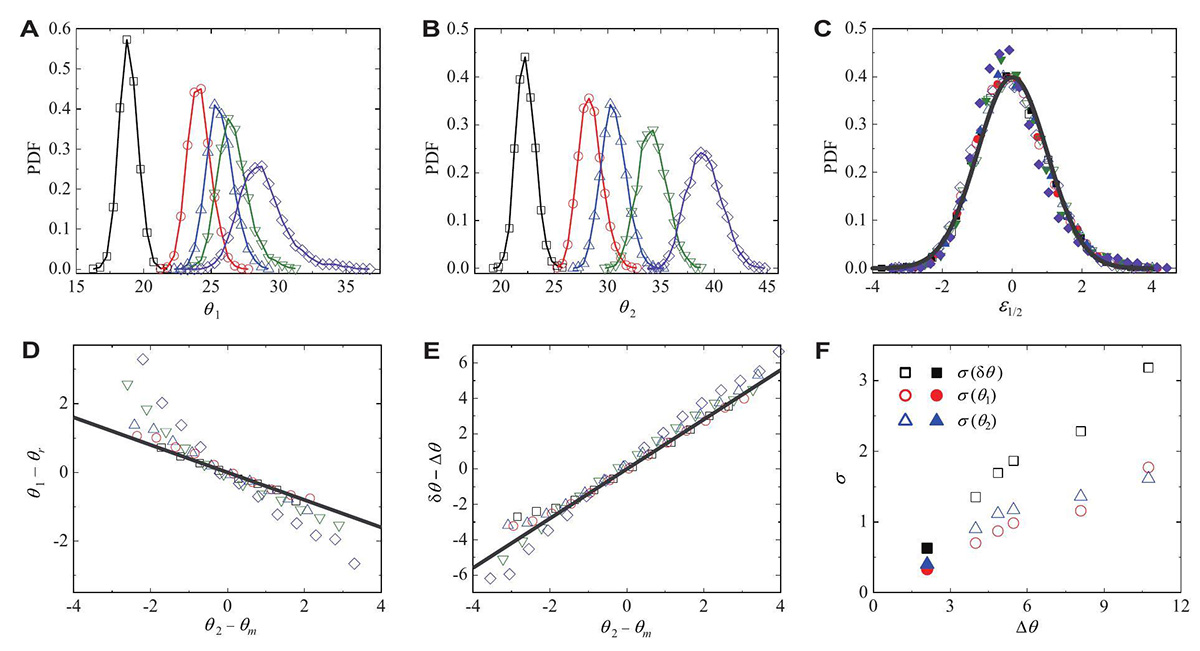
Distributions of individual (A) stopping angle θ1 and (B) starting angle θ for five types of beads of d = 5/6 mm. (C) Normalized distribution of ε1 for θ1 (or ε2 for θ2). Curve indicates the normal distribution. (D) Conditional average of θ1 - θr and (E) δθ - Δθ as functions of the preceding θ2 - θm. Straight lines in (D) and (E) indicate y = -0.4x and y = 1.4x, respectively. (F) Standard deviations of P(δθ), P(θ1), and P(θ2) as functions of Δθ. Solid points refer to the results of glass beads of d = 2 mm.
Current usage metrics show cumulative count of Article Views (full-text article views including HTML views, PDF and ePub downloads, according to the available data) and Abstracts Views on Vision4Press platform.
Data correspond to usage on the plateform after 2015. The current usage metrics is available 48-96 hours after online publication and is updated daily on week days.
Initial download of the metrics may take a while.