Figure 6
Download original image
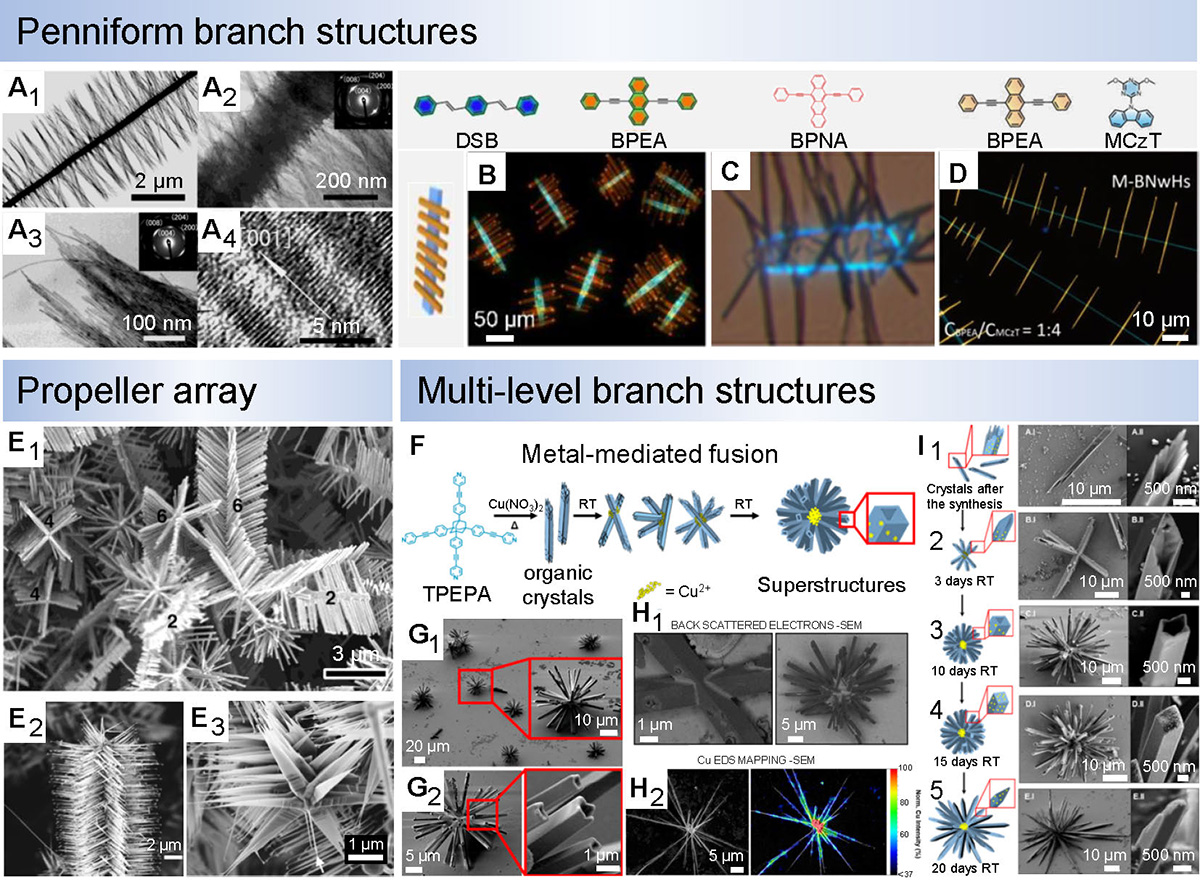
(A1) The low magnification TEM image of penniform BaWO4 nanostructures. (A2) Locally enlarged TEM image of the shaft of the penniform BaWO4 nanostructure. (A3) Locally enlarged TEM image of the barbs of the penniform BaWO4 nanostructure. The upper right inset shows the corresponding electron diffraction patterns of the main core and tufts. (A4) A magnified image of the tuft portion of the penniform structure. Scale bars: (A1) 2 μm; (A2) 200 nm; (A3) 100 nm; (A4) 5 nm (Reproduced from Ref. [136]. Copyright©2003, American Chemical Society). (B)–(D) FM images of DSB-BPEA (B), DSB-BPNA (C), and BPEA-MCzT (D) highly branched superstructures. Scale bars: (B) 50 μm; (D) 10 μm. (B)–(D) Reproduced from Refs. [138–140], respectively. Copyright©2022, Wiley‐VCH GmbH; Copyright©2021, The Author(s); Copyright©2022, Royal Society of Chemistry. (E1) SEM images of ZnO propeller-like nanostructures containing various symmetric structures marked as 6-, 4-, 2-fold. Scale bar is 3 μm (Reproduced from Ref. [141]. Copyright©2002, American Chemical Society). (E2) SEM image of the ZnO nanopropeller array. (E3) SEM image of the front view of the ZnO nanopropeller array (Reproduced from Ref. [142]. Copyright©2004, AIP Publishing). (F) Schematic representation of the formation of a hollow multi-level branch superstructures through metal-mediated fusion of TPEPA crystals. (G1), (G2) SEM images of TPEPA multi-level branch superstructure after 12 days of aging, showing the formation of complex branch structures and their hollow morphology. Scale bars: (G1) 20 μm, inset 10 μm; (G2) 5 μm, inset 1 μm. (H1) SEM backscattered images of hollow TPEPA superstructures. Scale bars: left 1 μm, right 5 μm. (H2) SEM secondary electron image (left) and mapping of copper by EDS-SEM (right) of a superstructure. Scale bars: 5 μm. (I) Right (1–5): schematic illustration of the process of recombination of TPEPA crystals into a multi-level branched superstructure as the reaction time continued. Right: Time-correlated ex situ SEM images showing specific changes in the fusion of TPEPA crystals into the superstructure. Inset: the evolution of the branch tip, showing the formation of the hollow topography. Scale bars are 10 and 500 μm (Reproduced from Ref. [143]. Copyright©2018, American Chemical Society).
Current usage metrics show cumulative count of Article Views (full-text article views including HTML views, PDF and ePub downloads, according to the available data) and Abstracts Views on Vision4Press platform.
Data correspond to usage on the plateform after 2015. The current usage metrics is available 48-96 hours after online publication and is updated daily on week days.
Initial download of the metrics may take a while.