Figure 7
Download original image
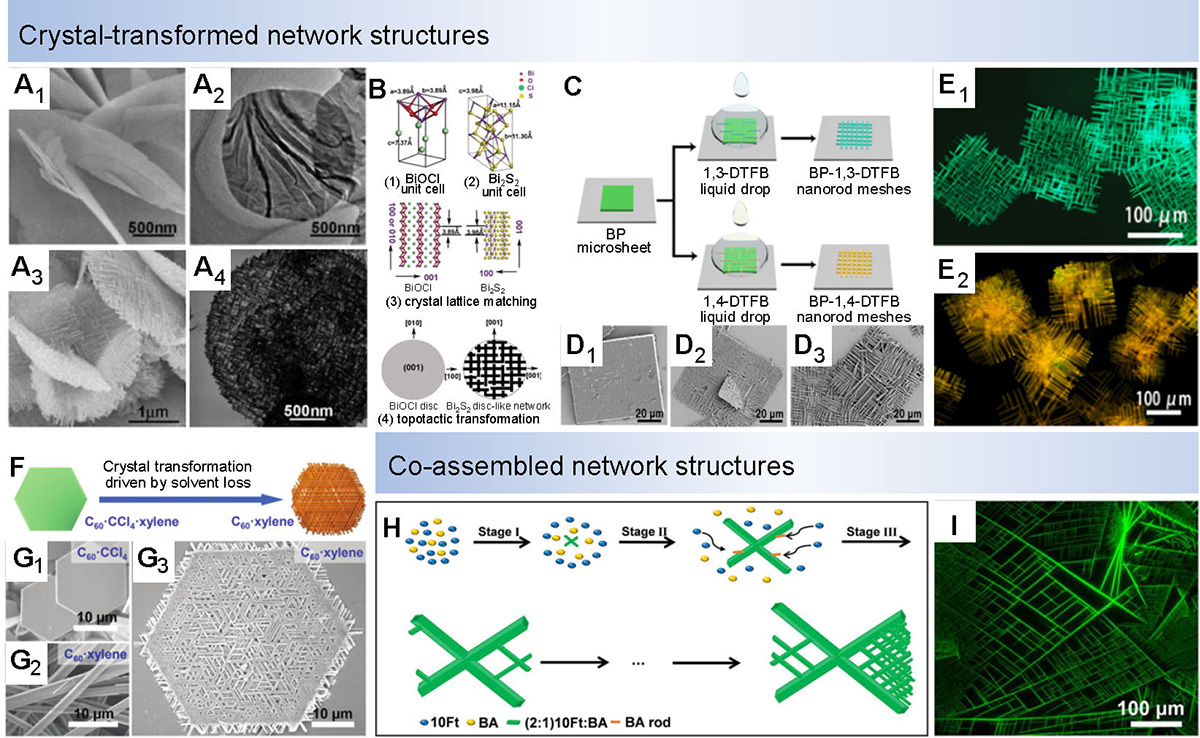
(A1), (A2) SEM image (A1) and TEM image (A2) of the BiOCl precursor discs. Scale bars are 500 nm. (A3), (A4) SEM image (A3) and TEM image (A4) of disc-like networks consists of Bi2S3 nanorod. Scale bars are 1 μm and 500 nm, respectively. (B) (1) Schematic diagram of BiOCl tetragonal unit cell; (2) Bi2S3 orthorhombic unit cell; (3) lattice matching between BiOCl and Bi2S3; (4) schematic diagram of the crystalline topological transition of BiOCl disc structure to Bi2S3 disc-like network superstructure (Reproduced from Ref. [144]. Copyright©2008, WILEY‐VCH Verlag GmbH & Co. KGaA, Weinheim). (C) Schematic illustration of the fabrication of BP-based cocrystal nanorod network structures through the crystallographic transformation process induced by etching BP microsheets. (D1)–(D3) Evolution process of different stages from BP microsheets to BP-1,3-DTFB nanorod networks. Scale bars are 20 μm. (E1) FM image of BP-1,3-DTFB nanorod network structures. (E2) FM images of BP-1,4-DTFB nanorod network structures. Scale bars are 100 μm (Reproduced from Ref. [145]. Copyright©2020, American Chemical Society). (F) Schematic illustration of the transformation from C60 plates to network structures driven by solvent loss. (G1), (G2) SEM images of (G1) C60 disks and (G2) C60 rods synthesized in the presence of CCl4/IPA and m-xylene/IPA mixtures, respectively. (G3) SEM image of a typical C60 network superstructure. Scale bars are all 10 μm (Reproduced from Ref. [146]. Copyright©2003, 2020, RSC Pub). (h) Schematic showing the mechanism for the preparation of hyperbranched (2:1)10Ft:BA MW networks through a stepwise co-assembly process. (I) FM image of the co-assembled network of 10Ft and BA excited by UV light. Scale bars are all 100 μm (Reproduced from Ref. [147].Copyright©2021, Wiley-VCH GmbH).
Current usage metrics show cumulative count of Article Views (full-text article views including HTML views, PDF and ePub downloads, according to the available data) and Abstracts Views on Vision4Press platform.
Data correspond to usage on the plateform after 2015. The current usage metrics is available 48-96 hours after online publication and is updated daily on week days.
Initial download of the metrics may take a while.