Figure 4
Download original image
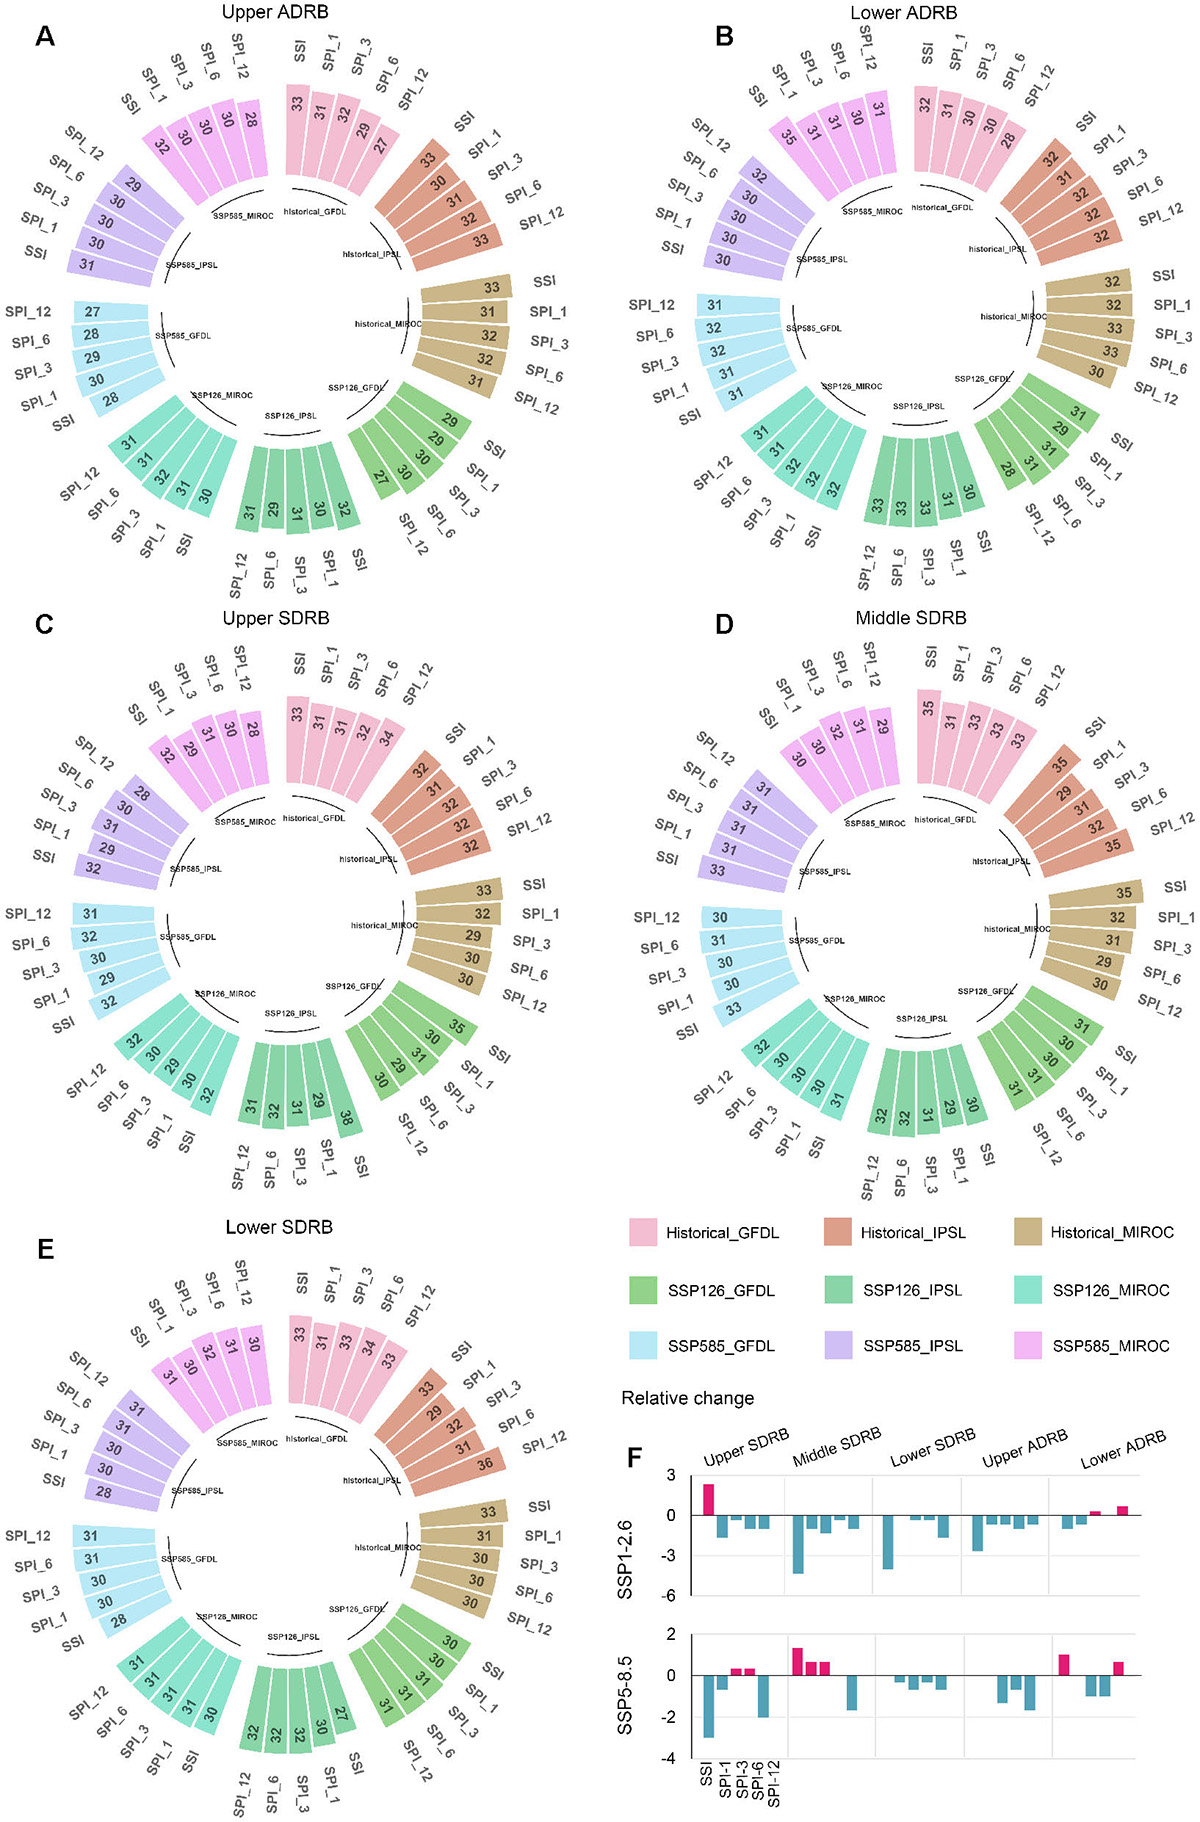
The ratios of the months when droughts occur during 1950–2099 for Amu Darya River basin (A, B) and the Syr Darya River basin (C–E), and their relative change between future and historical periods (F).
Current usage metrics show cumulative count of Article Views (full-text article views including HTML views, PDF and ePub downloads, according to the available data) and Abstracts Views on Vision4Press platform.
Data correspond to usage on the plateform after 2015. The current usage metrics is available 48-96 hours after online publication and is updated daily on week days.
Initial download of the metrics may take a while.