Figure 12
Download original image
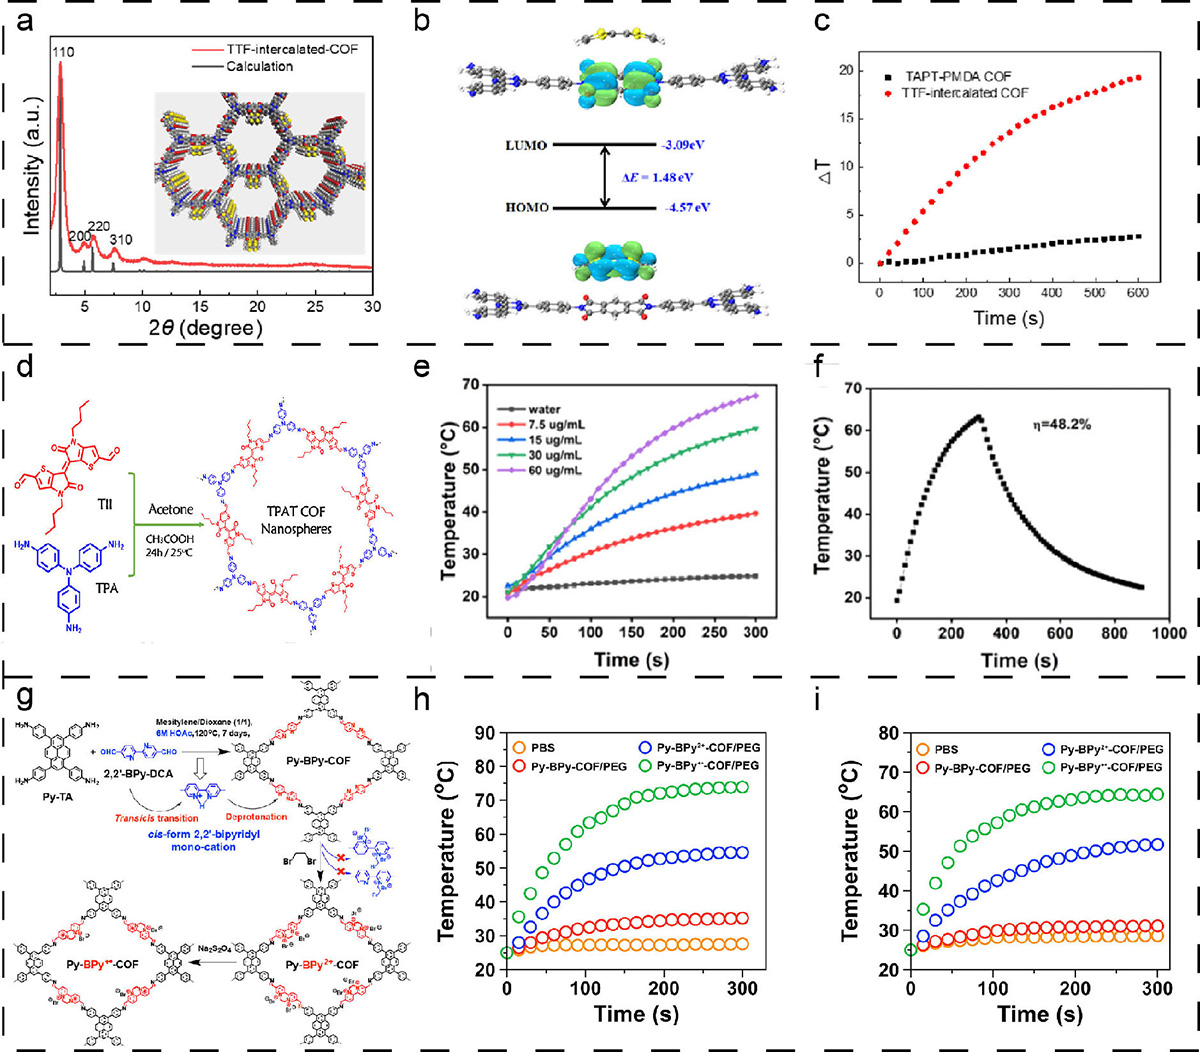
(a) PXRD test for TTF-intercalated COF (Structure diagram inset). (b) HOMO and LUMO surface plots from DFT calculations of TTF-intercalated COF. (c) Photothermal temperature curve of TAPT-PMDA COF and TTF-intercalated-COF. Reproduced with permission from Ref. [94], Copyright 2023, Elsevier. (d) Monomers and the preparation route of TPAT COF. (e) Photothermal temperature curve of TPAT COF under various concentrations. (f) Single heating cooling diagram of TPAT COF. Reproduced with permission from Ref. [197], Copyright 2022, American Chemical Society. (g) Preparation flow chart of Py-BPy+•-COF. Photothermal temperature curves of various PEG-modified COFs under 2 kinds of lasers: (h) 808 nm, (i) 1064 nm. Reproduced with permission from Ref. [99], Copyright 2019, American Chemical Society.
Current usage metrics show cumulative count of Article Views (full-text article views including HTML views, PDF and ePub downloads, according to the available data) and Abstracts Views on Vision4Press platform.
Data correspond to usage on the plateform after 2015. The current usage metrics is available 48-96 hours after online publication and is updated daily on week days.
Initial download of the metrics may take a while.