Figure 8
Download original image
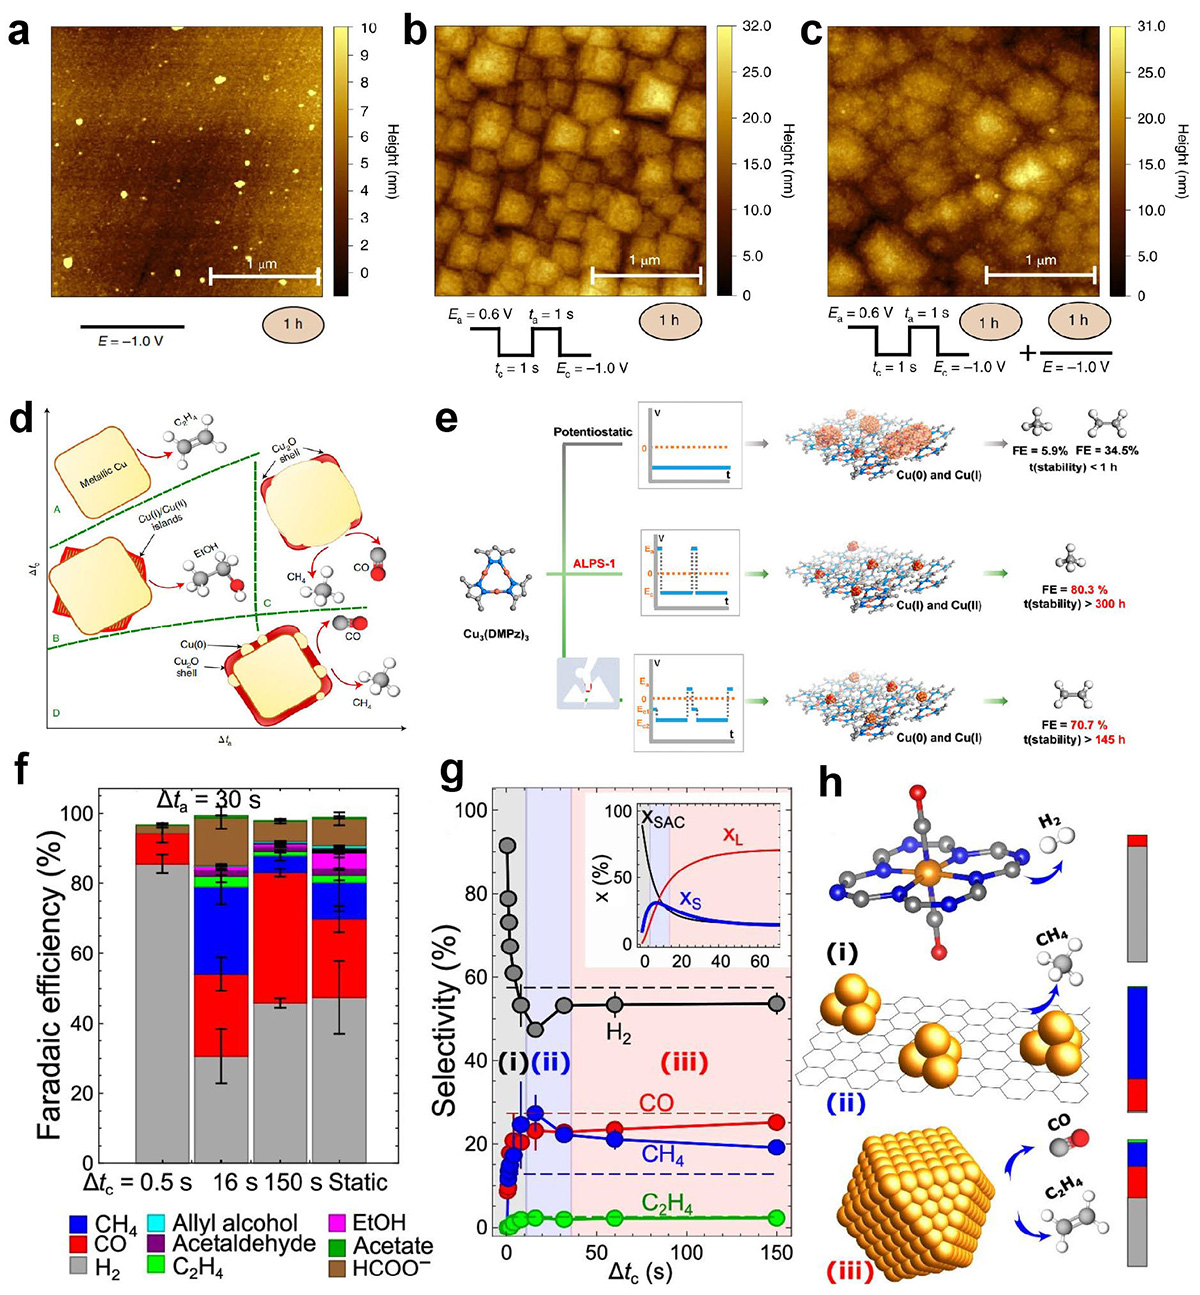
Atomic force microscopy images of a Cu (100) electrode after different surface treatments and reaction settings. (a) Constant potential of −1.0 V versus RHE; Pulsed electrolysis: (b) Ea= 0.6 V, Ec= −1.0 V, ta=tc= 1 s. (c) The surface from panel (b) after a subsequent hour of potentiostatic electrolysis at −1.0 V versus RHE. (Reproduced from Ref. [62]. Copyright©2020, Springer Nature Limited). (d) Schematic depiction of the catalyst structure and composition during a cathodic pulse extracted from XAS and XRD data. (Reproduced from Ref. [25]. Copyright©2022, Springer Nature Limited). (e) Design and performance of ALPS-1, ALPS-2, and potentiostatic methods for Cu3(DMPz)3 Catalyst (Reproduced from Ref. [48]. Copyright©2023, American Chemical Society). (f) Faradaic efficiencies of the reaction products under static CO2RR at −1.35 V and under pulsed CO2RR with Ec = − 1.35 V, Ea = 0.44 V, Δta = 30 s and different Δtc values (30, 10, and 1 s). (g) Corresponding selectivity for H2 and the main gaseous CO2RR products as a function of Δtc. Inset: calculated concentrations of Cu within cationic single site species (xSAC), small Cu clusters (xS), and large Cu nanoparticles (xL). Shaded regions indicated as (i), (ii), and (iii) mark three distinct regimes with different selectivity trends, and dominated by different Cu species, as indicated in (h) (Reproduced from Ref. [114]. Copyright©2024, Springer Nature Limited).
Current usage metrics show cumulative count of Article Views (full-text article views including HTML views, PDF and ePub downloads, according to the available data) and Abstracts Views on Vision4Press platform.
Data correspond to usage on the plateform after 2015. The current usage metrics is available 48-96 hours after online publication and is updated daily on week days.
Initial download of the metrics may take a while.