Figure 3
Download original image
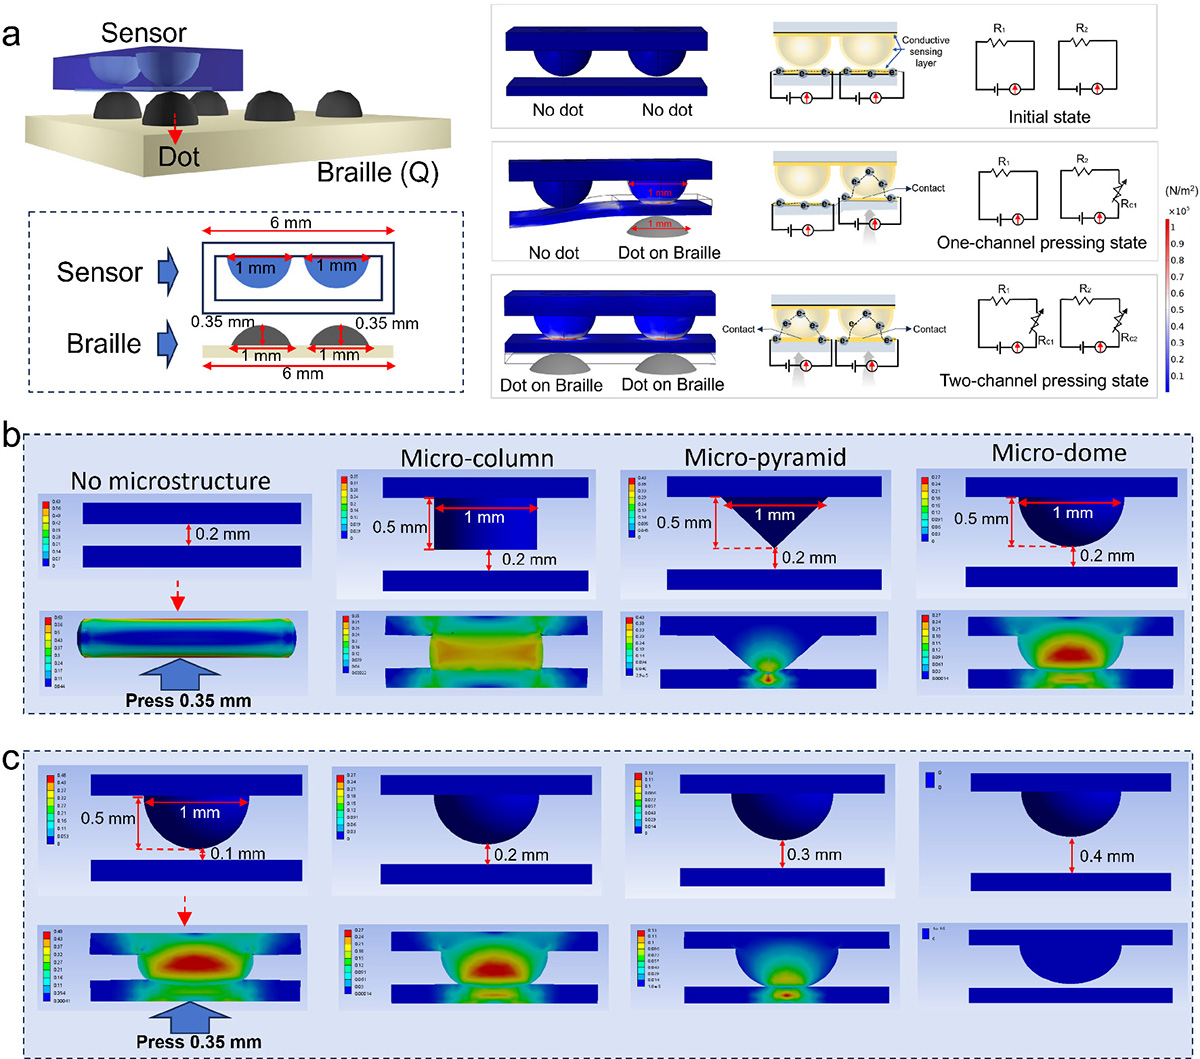
Structure design and analysis of tactile sensor. (a) Illustration of the dimensions of the tactile sensor and scanned Braille, and finite-element calculations show the deformation and the local stress distribution of tactile sensor when without dot on Braille, with one-side dot, and with two-side dots on Braille. (b) Finite-element calculations show the deformation and the local stress distribution of tactile sensor with no microstructure, micro-column, micro-pyramid, and micro-sphere. (c) Finite-element calculations show the deformation and the local stress distribution of micro-sphere tactile sensor with different distances.
Current usage metrics show cumulative count of Article Views (full-text article views including HTML views, PDF and ePub downloads, according to the available data) and Abstracts Views on Vision4Press platform.
Data correspond to usage on the plateform after 2015. The current usage metrics is available 48-96 hours after online publication and is updated daily on week days.
Initial download of the metrics may take a while.