Figure 4
Download original image
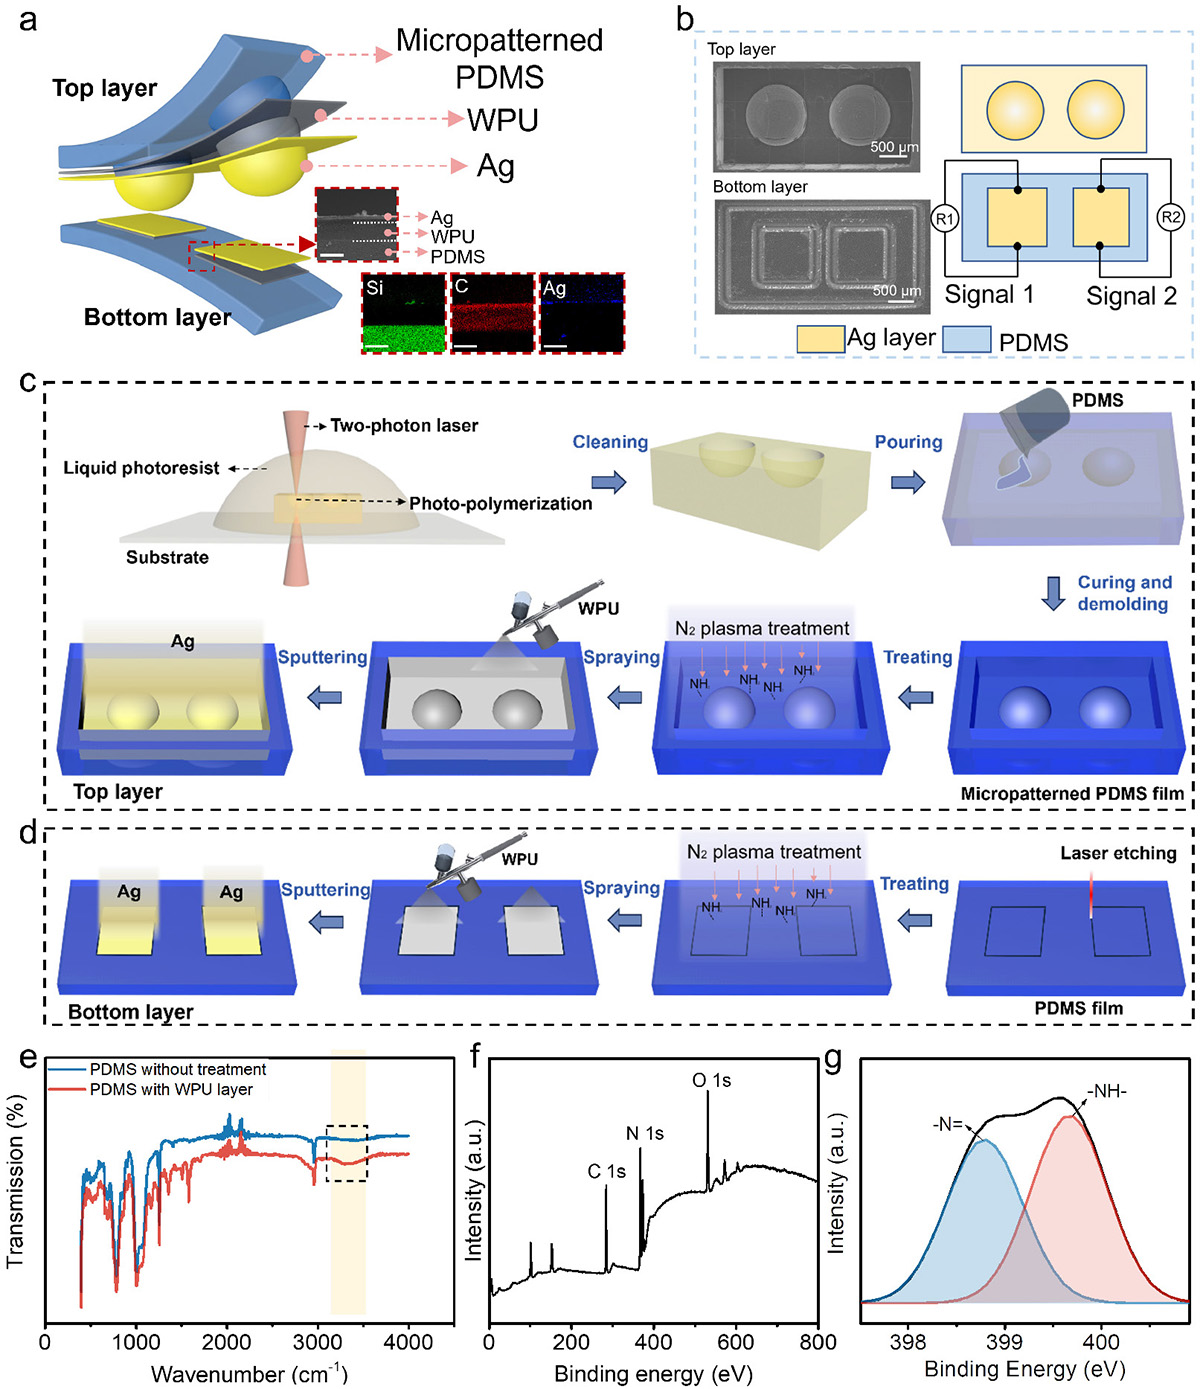
Characterization of the tactile sensor. (a) Explosive view of the micro-sphere tactile sensor (scale bar is 5 μm). (b) Scanning electron microscopy (SEM) images of the top and bottom layers of the 2B-sensor in top view, with right side showing the schematic of the top and bottom layers 2B-sensor. (c, d) Fabrication procedures of the top and bottom layers of the sensor. (e) FTIR spectra of the PDMS film before and after N2-plasma treatment. (f, g) XPS survey spectra of spectrum N 1s region of N2 plasma-treated PDMS film.
Current usage metrics show cumulative count of Article Views (full-text article views including HTML views, PDF and ePub downloads, according to the available data) and Abstracts Views on Vision4Press platform.
Data correspond to usage on the plateform after 2015. The current usage metrics is available 48-96 hours after online publication and is updated daily on week days.
Initial download of the metrics may take a while.