Figure 2

Download original image
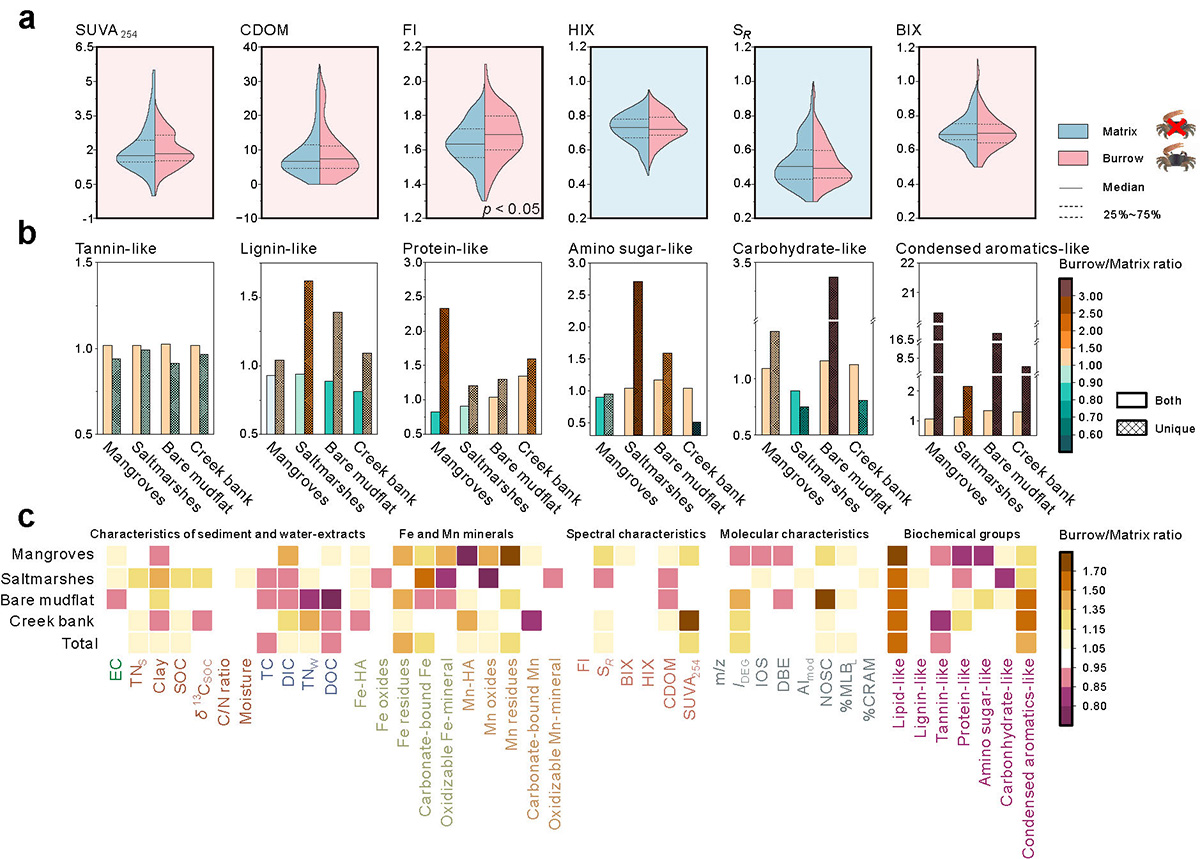
Crab burrowing enhances the release of labile molecules. (a) The violin plots compare DOM spectroscopic characteristic. Left violins in blue represent the sediment matrix and right violins in red represent the crab burrows. Red backgrounds represent values within burrows surpassing those of the matrix, while blue backgrounds indicate the opposite results. SUVA254 (L mg C−1 m−1): specific ultraviolet absorbance at 254 nm, CDOM (m−1): chromophoric dissolved organic matter, SR: spectral slope ratio. (b) Ratio of relative abundance (R.A.) of biochemical groups in crab burrows and sediment matrix (n = 20), including tannin-like, lignin-like, protein-like, condensed aromatic-like, carbohydrate-like, and amino sugar-like. Color gradients indicate the values of these ratios between crab burrows and the sediment matrix. Solid-colored bars represent molecules present in both the matrix and burrows; shaded bars represent molecules unique to either the matrix or burrows. (c) Heat map analysis of bulk characteristics of sediment and water extracts, Fe and Mn minerals, DOM spectral characteristics, molecular characteristics, and biochemical groups in the sediment matrix and crab burrows (n = 20). Color gradients indicate the values of these characteristics’ ratios in crab burrows and sediment matrix. IDEG: degradation index, IOS: island of stability, %CRAM: relative abundance of carboxyl-rich alicyclic molecules. Complete specific descriptions of DOM spectroscopic and molecular characteristics are provided in Tale S2.
Current usage metrics show cumulative count of Article Views (full-text article views including HTML views, PDF and ePub downloads, according to the available data) and Abstracts Views on Vision4Press platform.
Data correspond to usage on the plateform after 2015. The current usage metrics is available 48-96 hours after online publication and is updated daily on week days.
Initial download of the metrics may take a while.

