Figure 3
Download original image
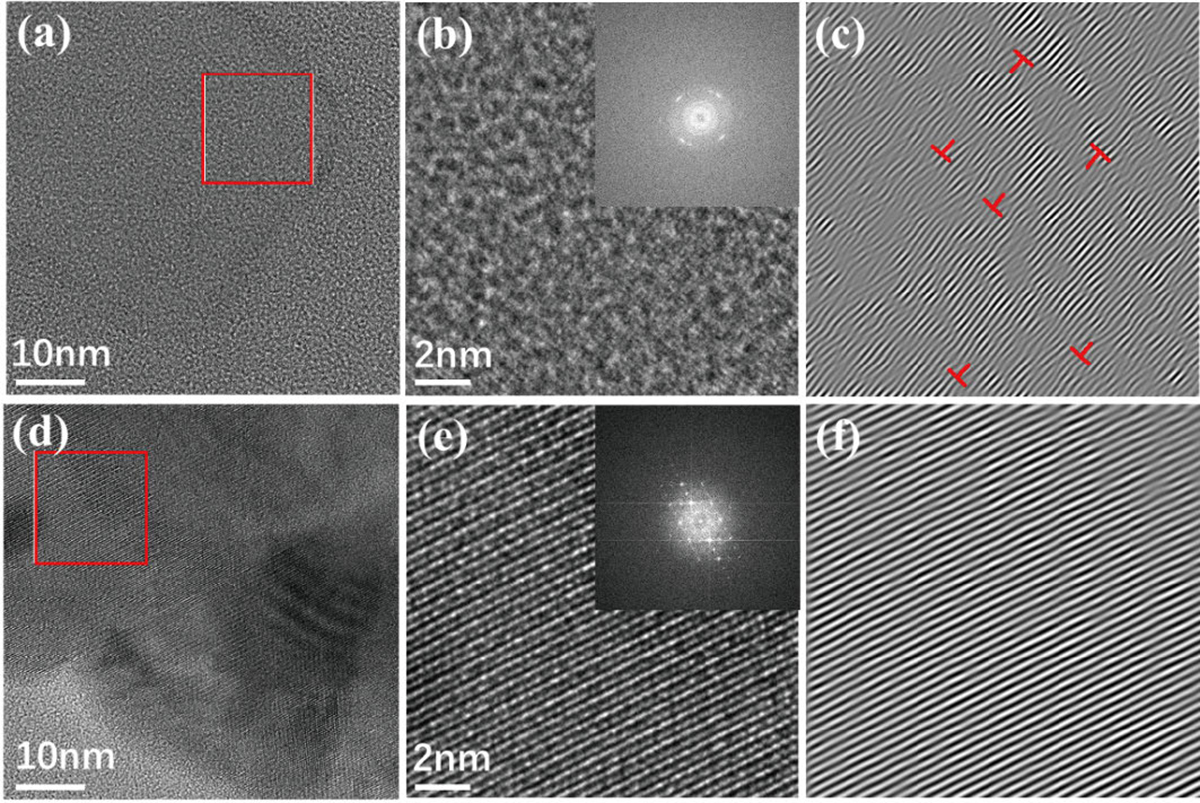
The TEM pattern of p-Bi0.5Sb1.5Te3 before and after annealing. (a) Lattice of the sample before annealing. (b) A larger view of the area in the box in (a) and its FFT image. (c) The iFFT image corresponding to the box area in (a). (d) Lattice of the sample after annealing. (e) A larger view of the area in the box in (d) and its FFT image. (f) The iFFT image corresponds to the box area in (d).
Current usage metrics show cumulative count of Article Views (full-text article views including HTML views, PDF and ePub downloads, according to the available data) and Abstracts Views on Vision4Press platform.
Data correspond to usage on the plateform after 2015. The current usage metrics is available 48-96 hours after online publication and is updated daily on week days.
Initial download of the metrics may take a while.