Figure 3
Download original image
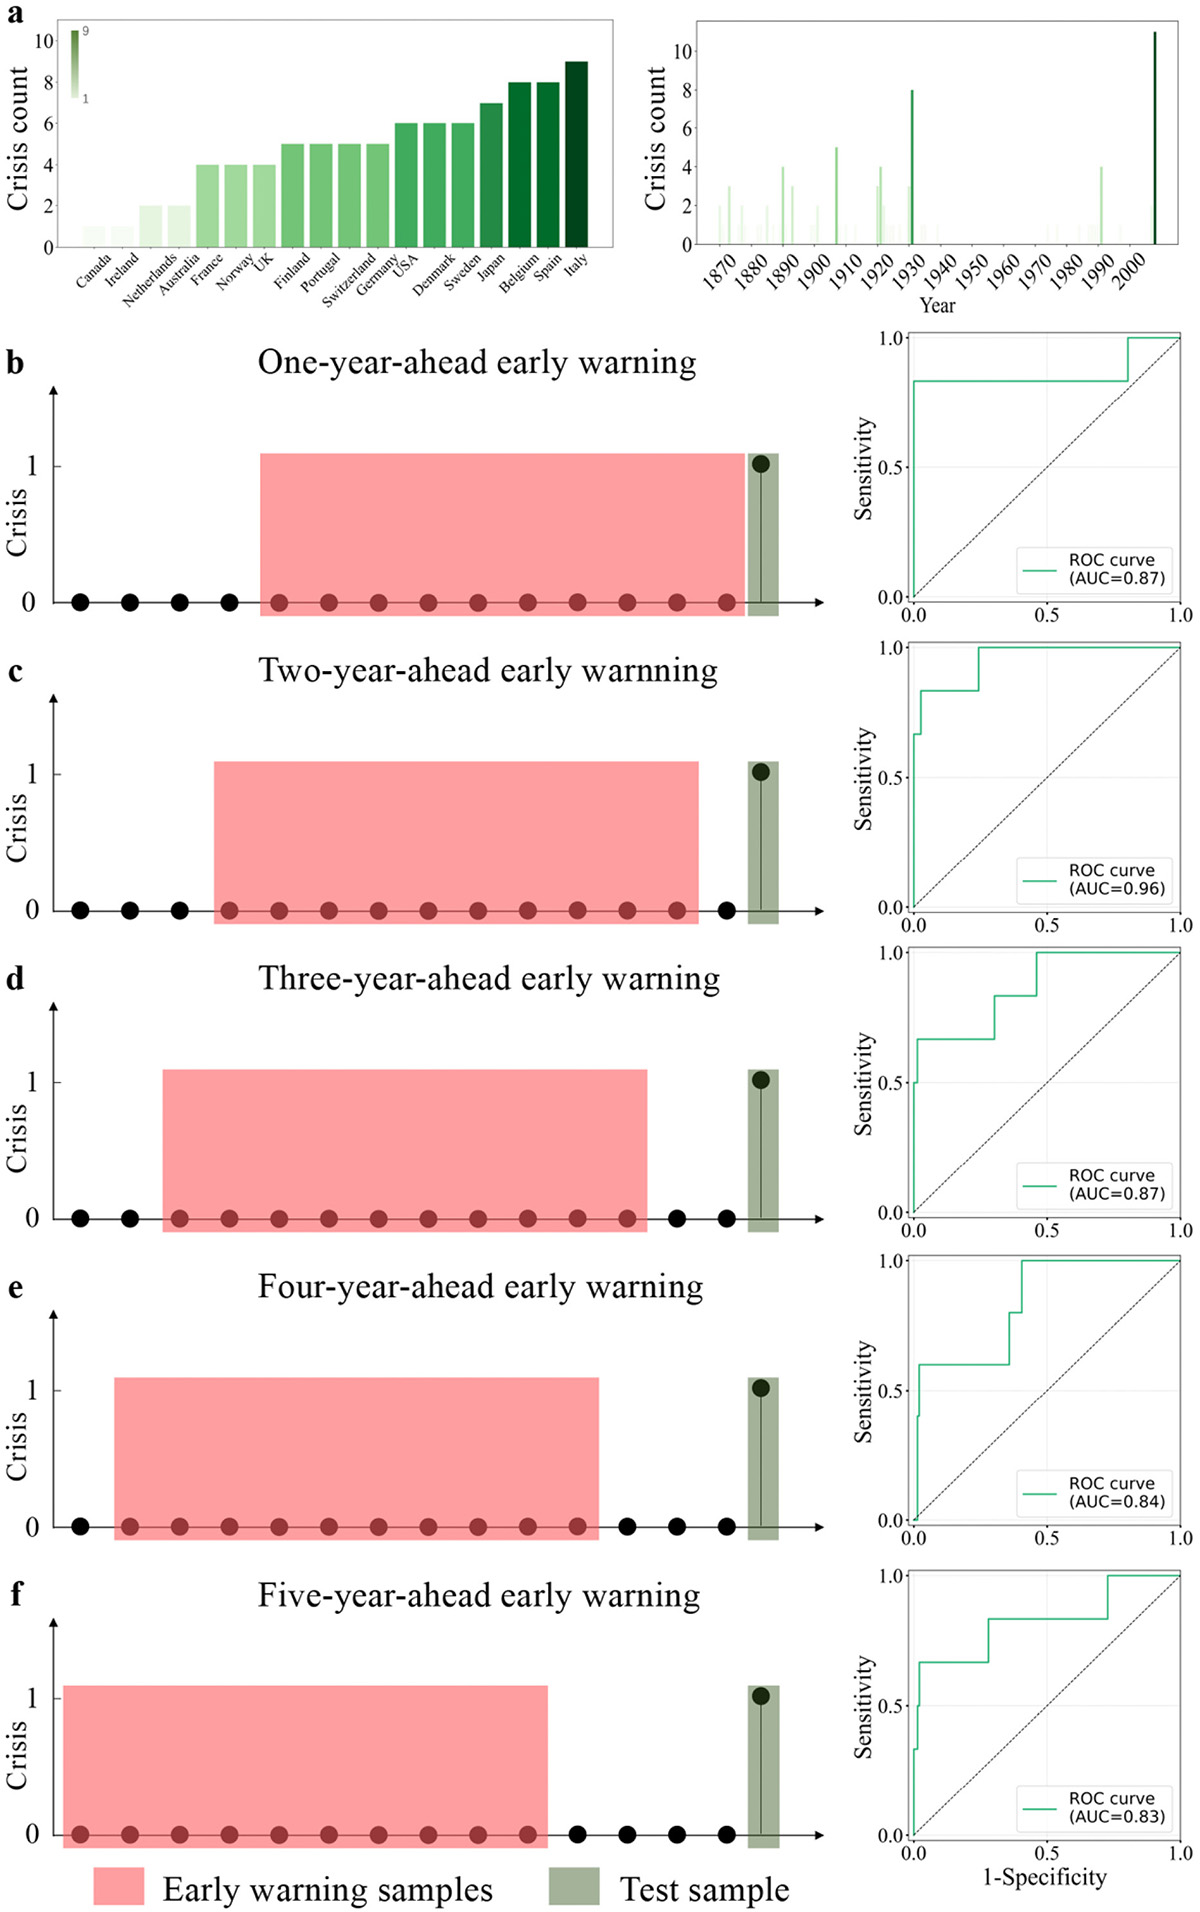
Qualitative early-warning performance of CT-eProber for systemic financial crises. (a) Distribution of 88 systemic financial crises across countries (left) and years (right) over the period 1870–2016, where the colour denotes the number of crises. (b)–(f) Schematic illustration of one-, two-, three-, four- and five-year-ahead early warning tasks for systemic financial crises, together with the corresponding receiver operating characteristic (ROC) curves.
Current usage metrics show cumulative count of Article Views (full-text article views including HTML views, PDF and ePub downloads, according to the available data) and Abstracts Views on Vision4Press platform.
Data correspond to usage on the plateform after 2015. The current usage metrics is available 48-96 hours after online publication and is updated daily on week days.
Initial download of the metrics may take a while.