Figure 2
Download original image
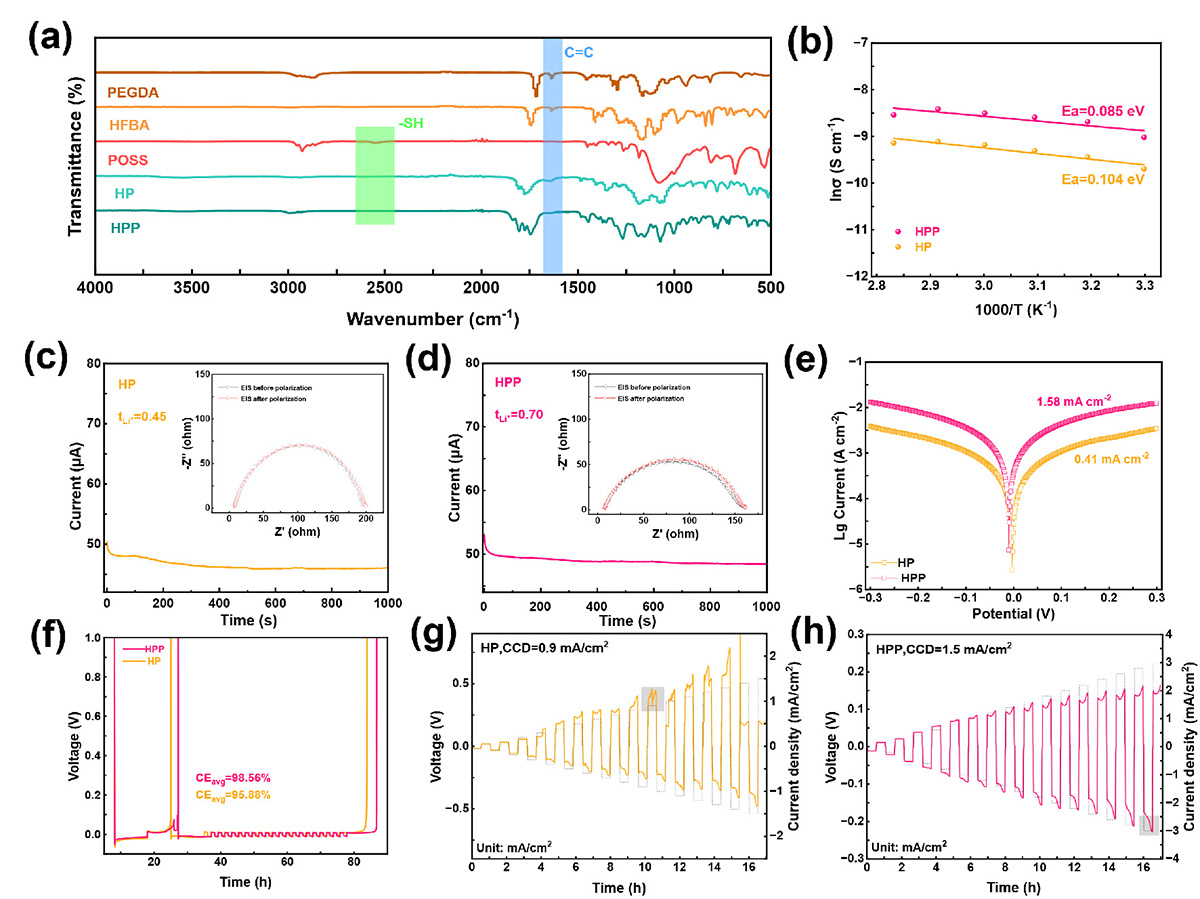
(a) FTIR spectra of polymer precursors and resulting polymers. (b) Ionic conductivity of HPP and HP electrolytes from 30 to 80 °C, with fitted Arrhenius curves. Chronoamperometric curves of HP (c) and HPP (d) electrolytes, with insets showing impedance before and after polarization. (e) Tafel curves of symmetric cells assembled with HPP and HP electrolytes. (f) Coulombic efficiency measured by the Aurbach method. CCD of HP (g) and HPP (h) electrolytes.
Current usage metrics show cumulative count of Article Views (full-text article views including HTML views, PDF and ePub downloads, according to the available data) and Abstracts Views on Vision4Press platform.
Data correspond to usage on the plateform after 2015. The current usage metrics is available 48-96 hours after online publication and is updated daily on week days.
Initial download of the metrics may take a while.