Figure 2
Download original image
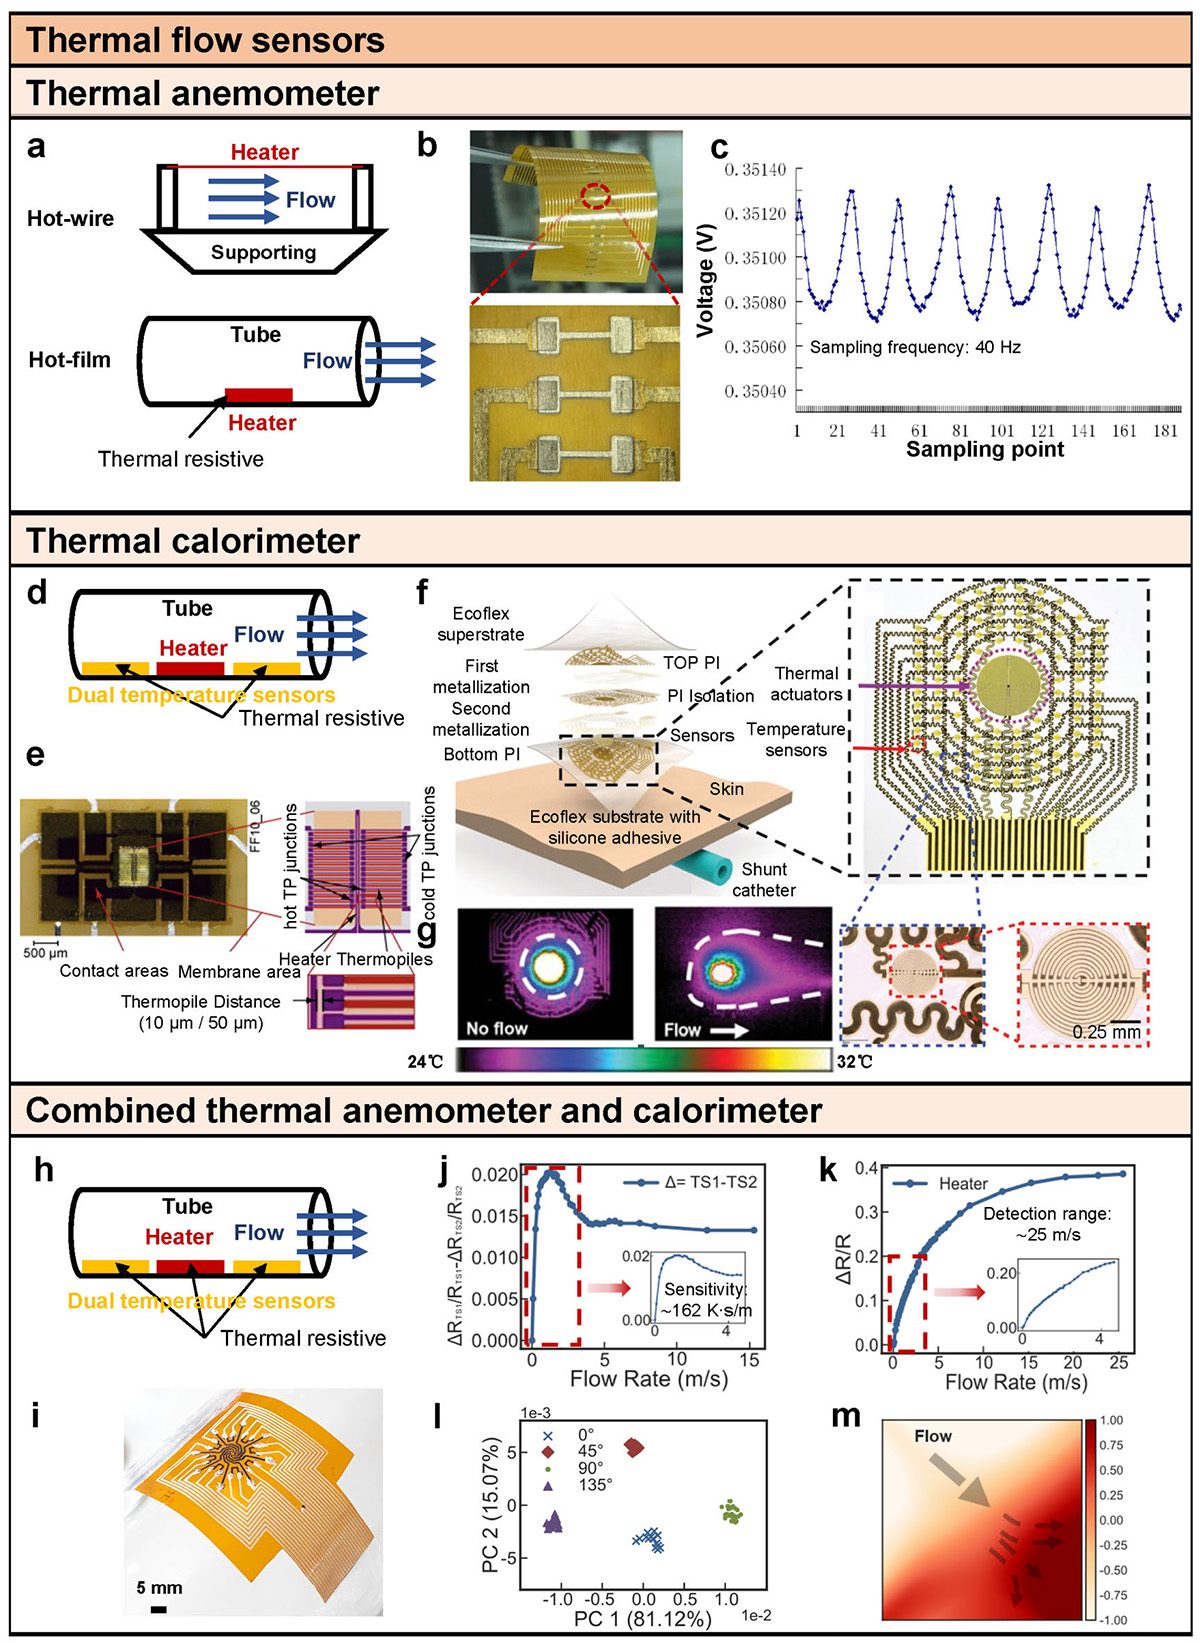
Thermal flow sensors. (a) Conceptual illustrations of thermal anemometer flow sensors: hot-wire and hot-film. (b) Fully flexible thermal anemometer sensor array on PI film substrate, with enlarged images showing sensor array and copper leads [26]. (c) Fully flexible thermal anemometer sensor’s output in wave flow [26]. (d) Conceptual illustration of thermal calorimeter flow sensors. (e) Top view of flexible thermal calorimeter flow sensors integrated on a printed circuit board (PCB) (left) and schematic of the membrane (right) [47]. (f) Exploded view illustration of a platform that incorporates a central thermal actuator surrounded by 100 precision temperature sensors, placed over the skin with an underlying shunt catheter, with enlarged images showing optical micrograph of the device (surrounded by black dashed line), serpentine interconnects (blue dashed line) and individual resistive temperature sensors (red dashed line) [49]. (g) IR thermographs with color and contrast enhancement highlight the spatial isotropy of the distribution of temperature in the absence of flow (left) and the anisotropy in the presence of flow (right). Flow is to the right (arrow) [49]. (h) Conceptual illustrations of thermal anemometer + thermal calorimeter flow sensors. (i) Photo images of the LIG-based flexible thermal anemometer + thermal calorimeter flow sensor on curved surfaces [50]. (j) Resistance variation measured from the two temperature sensors as a function of flow rate [50]. (k) Resistance variation measured from the heater as a function of flow rate [50]. (l) Principal component analysis of collected data from the eight temperature sensors under the four flow directions [50]. (m) Cubic convolution interpolation of the eight temperature sensors after normalization when the flow is incident at 45° [50].
Current usage metrics show cumulative count of Article Views (full-text article views including HTML views, PDF and ePub downloads, according to the available data) and Abstracts Views on Vision4Press platform.
Data correspond to usage on the plateform after 2015. The current usage metrics is available 48-96 hours after online publication and is updated daily on week days.
Initial download of the metrics may take a while.